Rational grouping of data to construct an XbarR-chart of subgroup means and ranges based on selected sources of variation and subgroup sizes. Three-way control chart.
“An important aspect of using control charts effectively is their ability to answer the right questions. To do this, the method of distributing data into subgroups must correspond to the structure of the data. This usually means that data from some “small area” - space, time, production batch - should be grouped into each subgroup so that the data within the subgroup is as homogeneous as possible. It is the variation within subgroups that is used to set control limits, which determine how much variation is acceptable between subgroups.”
![Button Rational grouping of data for the control XbarR-map of averages and ranges of subgroups]](https://advanced-quality-tools.ru/images/buttons/datagroup.jpg)
A unique and popular function for automating the construction of an XbarR-chart of averages and ranges of subgroups with rational grouping of data according to a user-selected factor column (type of variation source) and subgroup size.
![Button [Automatic update of graphs with Shewhart control charts]](https://advanced-quality-tools.ru/images/buttons/sqlite_autoplay.png)
This function is included in the list of parameters saved in the chart properties when saved in the list for automatic chart updates with a selected timeout or to quickly open them with updated data.
Important! If you need to group data to build an XbarR-chart of subgroup means and ranges, you must have at least one factor column in the source data table. If you have no factor entries at all, then in the single factor column insert any string value, for example [Not Specified].

Figure 1. Cause-and-effect diagram. Ishikawa (Fishbone) diagram with top level source of variation types (factor types).
The source of data for the rational grouping function is the initial data for constructing the XmR-chart of individual values.
When constructing a control XbarR-chart of averages and ranges of subgroups, automatically:
- the possibility of forming subgroups is checked according to user-selected conditions - [Type of factors], the values of which are the basis for the formation of subgroups, and [Size of subgroups];
- only complete subgroups of a size specified by the user are formed, and incomplete subgroups are cut off;
- after the data grouping is formed, the XbarR control chart displays vertical dotted lines the limits of action of the values of the sources of variation selected for grouping [Type of factors], separating a series of points;
If the selected [Factor type] is not a data column with subgroup numbers, if there is no checkmark in the [Factor type specifies the order of subgroups] checkbox in the data grouping control panel:
- in places where the values of the sources of variation change the connecting line between a series of dots breaks for greater clarity;
- all rules are turned off Western Electric zonal criteria , except for the First Rule, because the concept of consistency for the entire series of rationally grouped data requires additional attention to the context of the data.
For example, in the context of Donald Wheeler's article "Rational grouping of data" for the third method of organizing data into subgroups, the figure below shows a control XmR-chart of the source data, where the repeatedly repeating structure of the graph shape indicates a clear lack of homogeneity of the parts obtained from the four cavities of one mold.

Figure 2. XmR control chart of individual values for the original data before rational grouping. The order of points with repetitions [Cavity 1 - Cavity 2 - Cavity 3 - Cavity 4], vertical lines dividing series [Sampling hour]. The process is asymmetrical; there is no lower bound on the X-map. The [Rational Data Grouping] button is highlighted in the main control button panel.
For a better understanding of what is happening, the user can rationally group the data from which the control XmR-chart of individual values and moving ranges is built (Figure 2) by Factor Type [Cavity] and subgroup size [n=5] in accordance with the samples selected for control from five cycles in a row, sampled at the beginning of each hour, see Figure 3.
Below, Figure 3 shows a control XbarR-chart of the averages and ranges of subgroups for data organized into rational subgroups, which clearly demonstrates the clear difference between products produced by different cavities of the same mold, and Figures 4 and 5 confirm the significant difference in the process on the first and second days. Figure 6, with rational grouping by day with subgroup size [n=4], corresponding to one die cycle, also demonstrates this difference in the process on the first and second day.
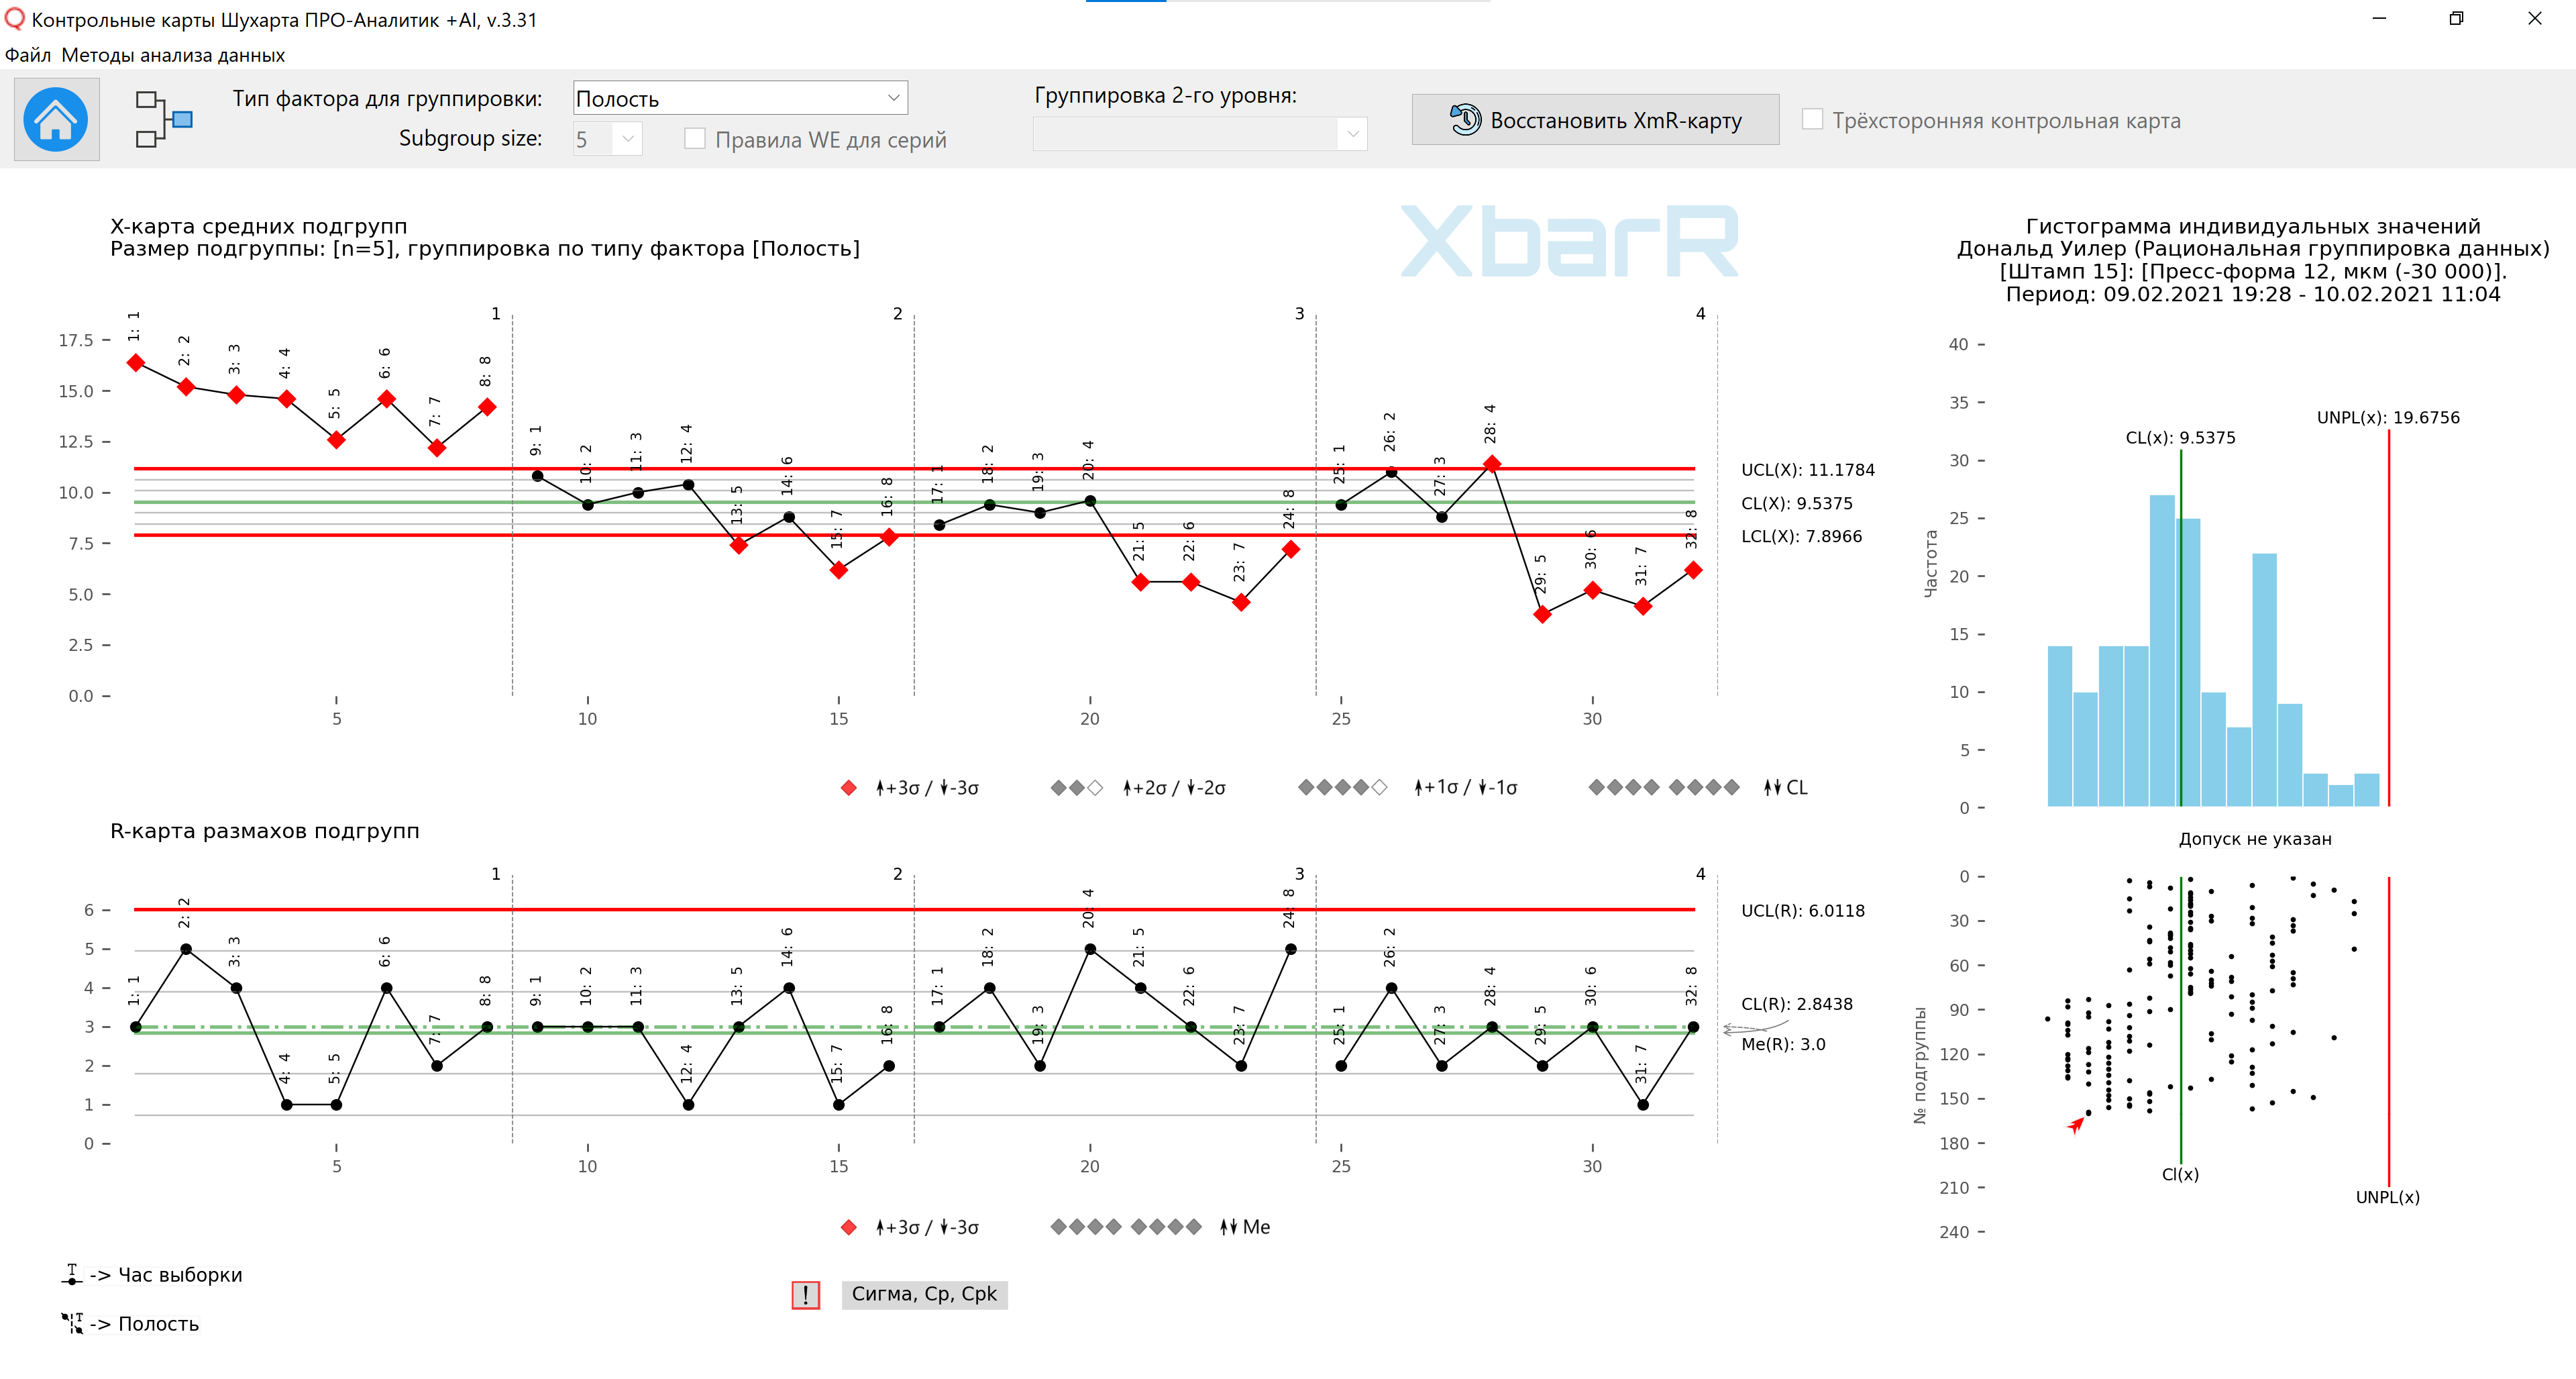
Figure 3. Control XbarR-chart of average and group ranges for data organized into rational subgroups of size [n=5] for the third method of organizing data in subgroups by factor type [Cavity]. Point labels [Sampling hour].

Rice. 4. Map of subgroup means and ranges for the third method of organizing data in subgroups with control limits for individual series of points. The graphs were constructed using the data grouping automation function to construct an XbarR-chart of the averages and ranges of subgroups by the selected type of sources of variation (Type of factors) and the size of subgroups with the additional use of the function constructing control limits for individual series of subgroups . Vertical lines of factors for each cavity divide the plot for the first and second days of sampling.

Rice. 5. Map of subgroup means and ranges for the third method of organizing data in subgroups with control limits for individual series of points. The graphs were constructed using the data grouping automation function to construct an XbarR-chart of the averages and ranges of subgroups by the selected type of sources of variation (Type of factors) and the size of subgroups with the additional use of the function constructing control limits for individual series of subgroups . Two zones for each cavity correspond to the first and second sampling days.

Figure 6. XbarR control chart of average and group ranges for data organized into rational subgroups by factor type [Day] with subgroup size [n=4] corresponding to the number of ball couplings produced per die cycle. Included only Western Electric Rule 1 .
Our software contains example data in Excel files used to describe this function.
This feature takes advantage of the XbarR average chart in terms of the ability to rationally group data by employee and is indispensable for assessing employee key performance indicators against the overall system boundaries. For example, to find out which employees work outside the system with better or worse results, and who works within the system.
For an example of using the function of grouping data on weekly revenue by sales department employees, see the open solution: A critical look at the use of KPIs in the personnel motivation system. Or how management deprives itself of the most important information for managing the company and destroys teamwork.
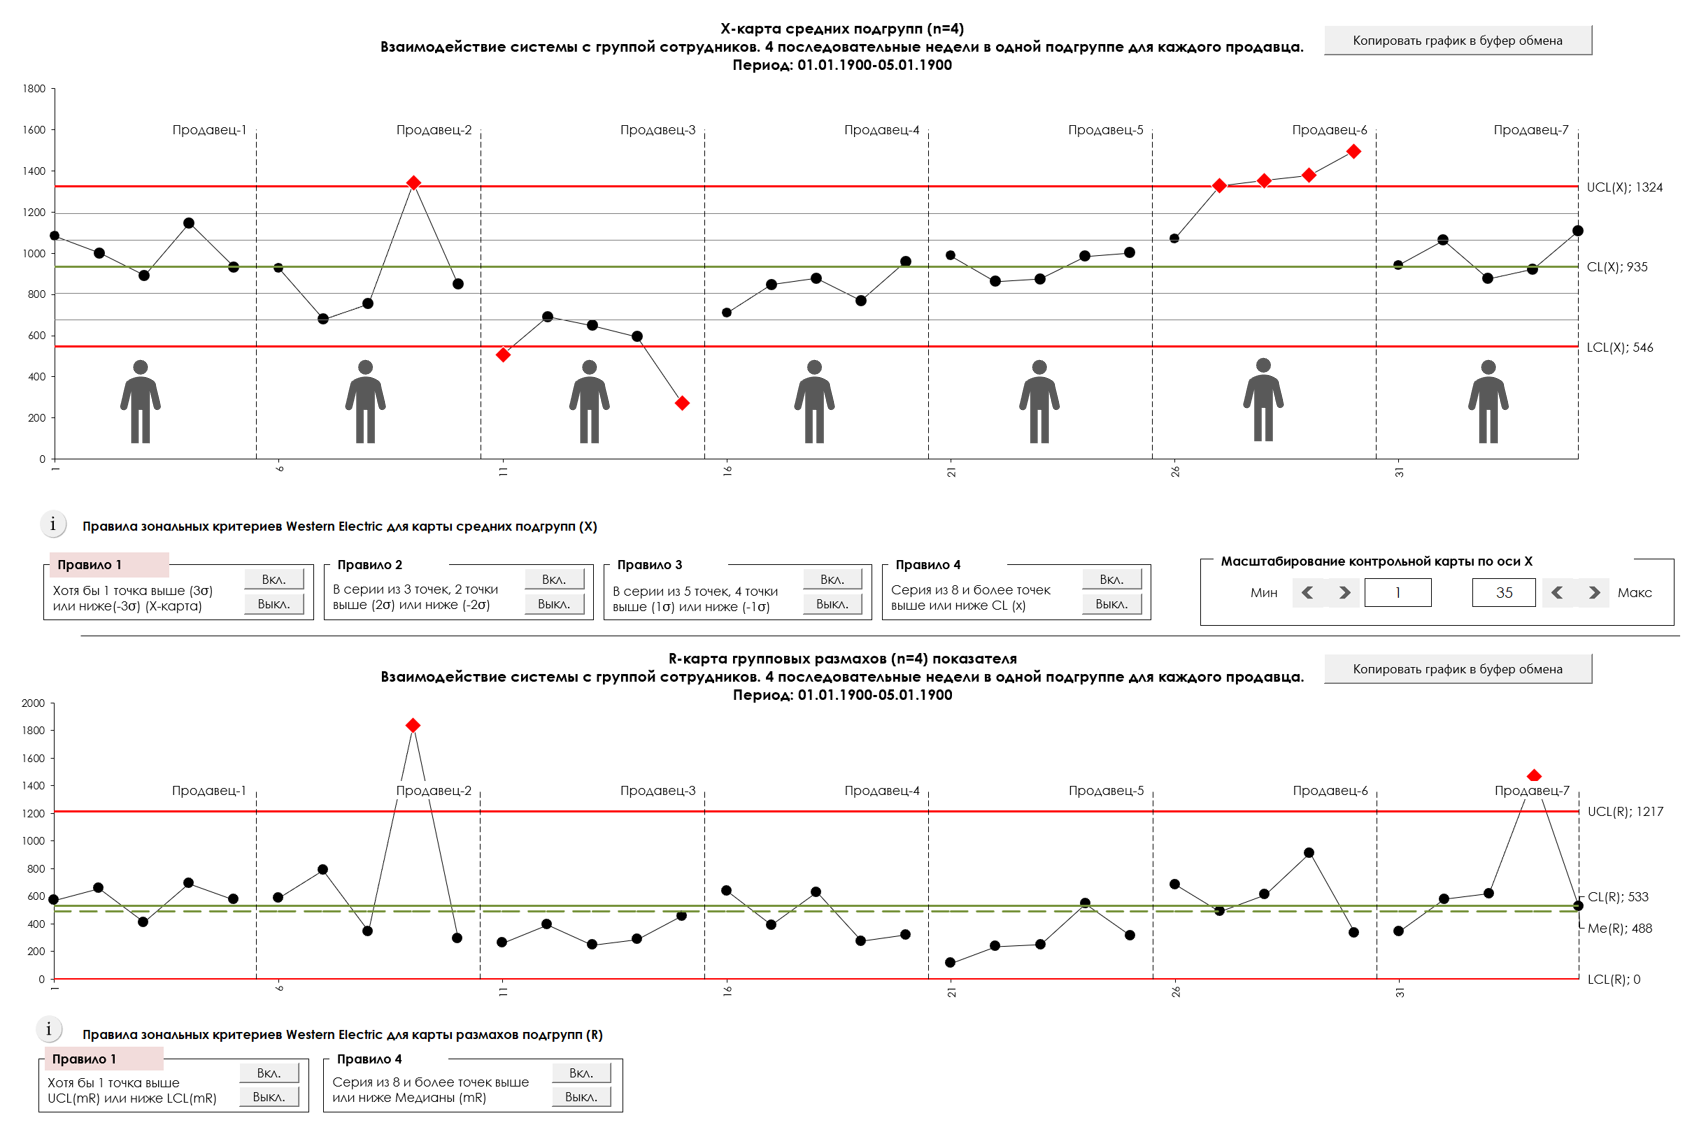
Figure 9. Interaction of the system with a group of employees. Control chart of averages and ranges of subgroups XbarR-chart. UCL - upper control limit, LCL - lower control limit, CL - center line. The drawing was prepared using our developed “Shewhart control charts PRO-Analyst +AI (for Windows, Mac, Linux)” .
Another example of use special group functions data presented in the article by Donald Wheeler: Evaluating the Measurement Process (EMP) .
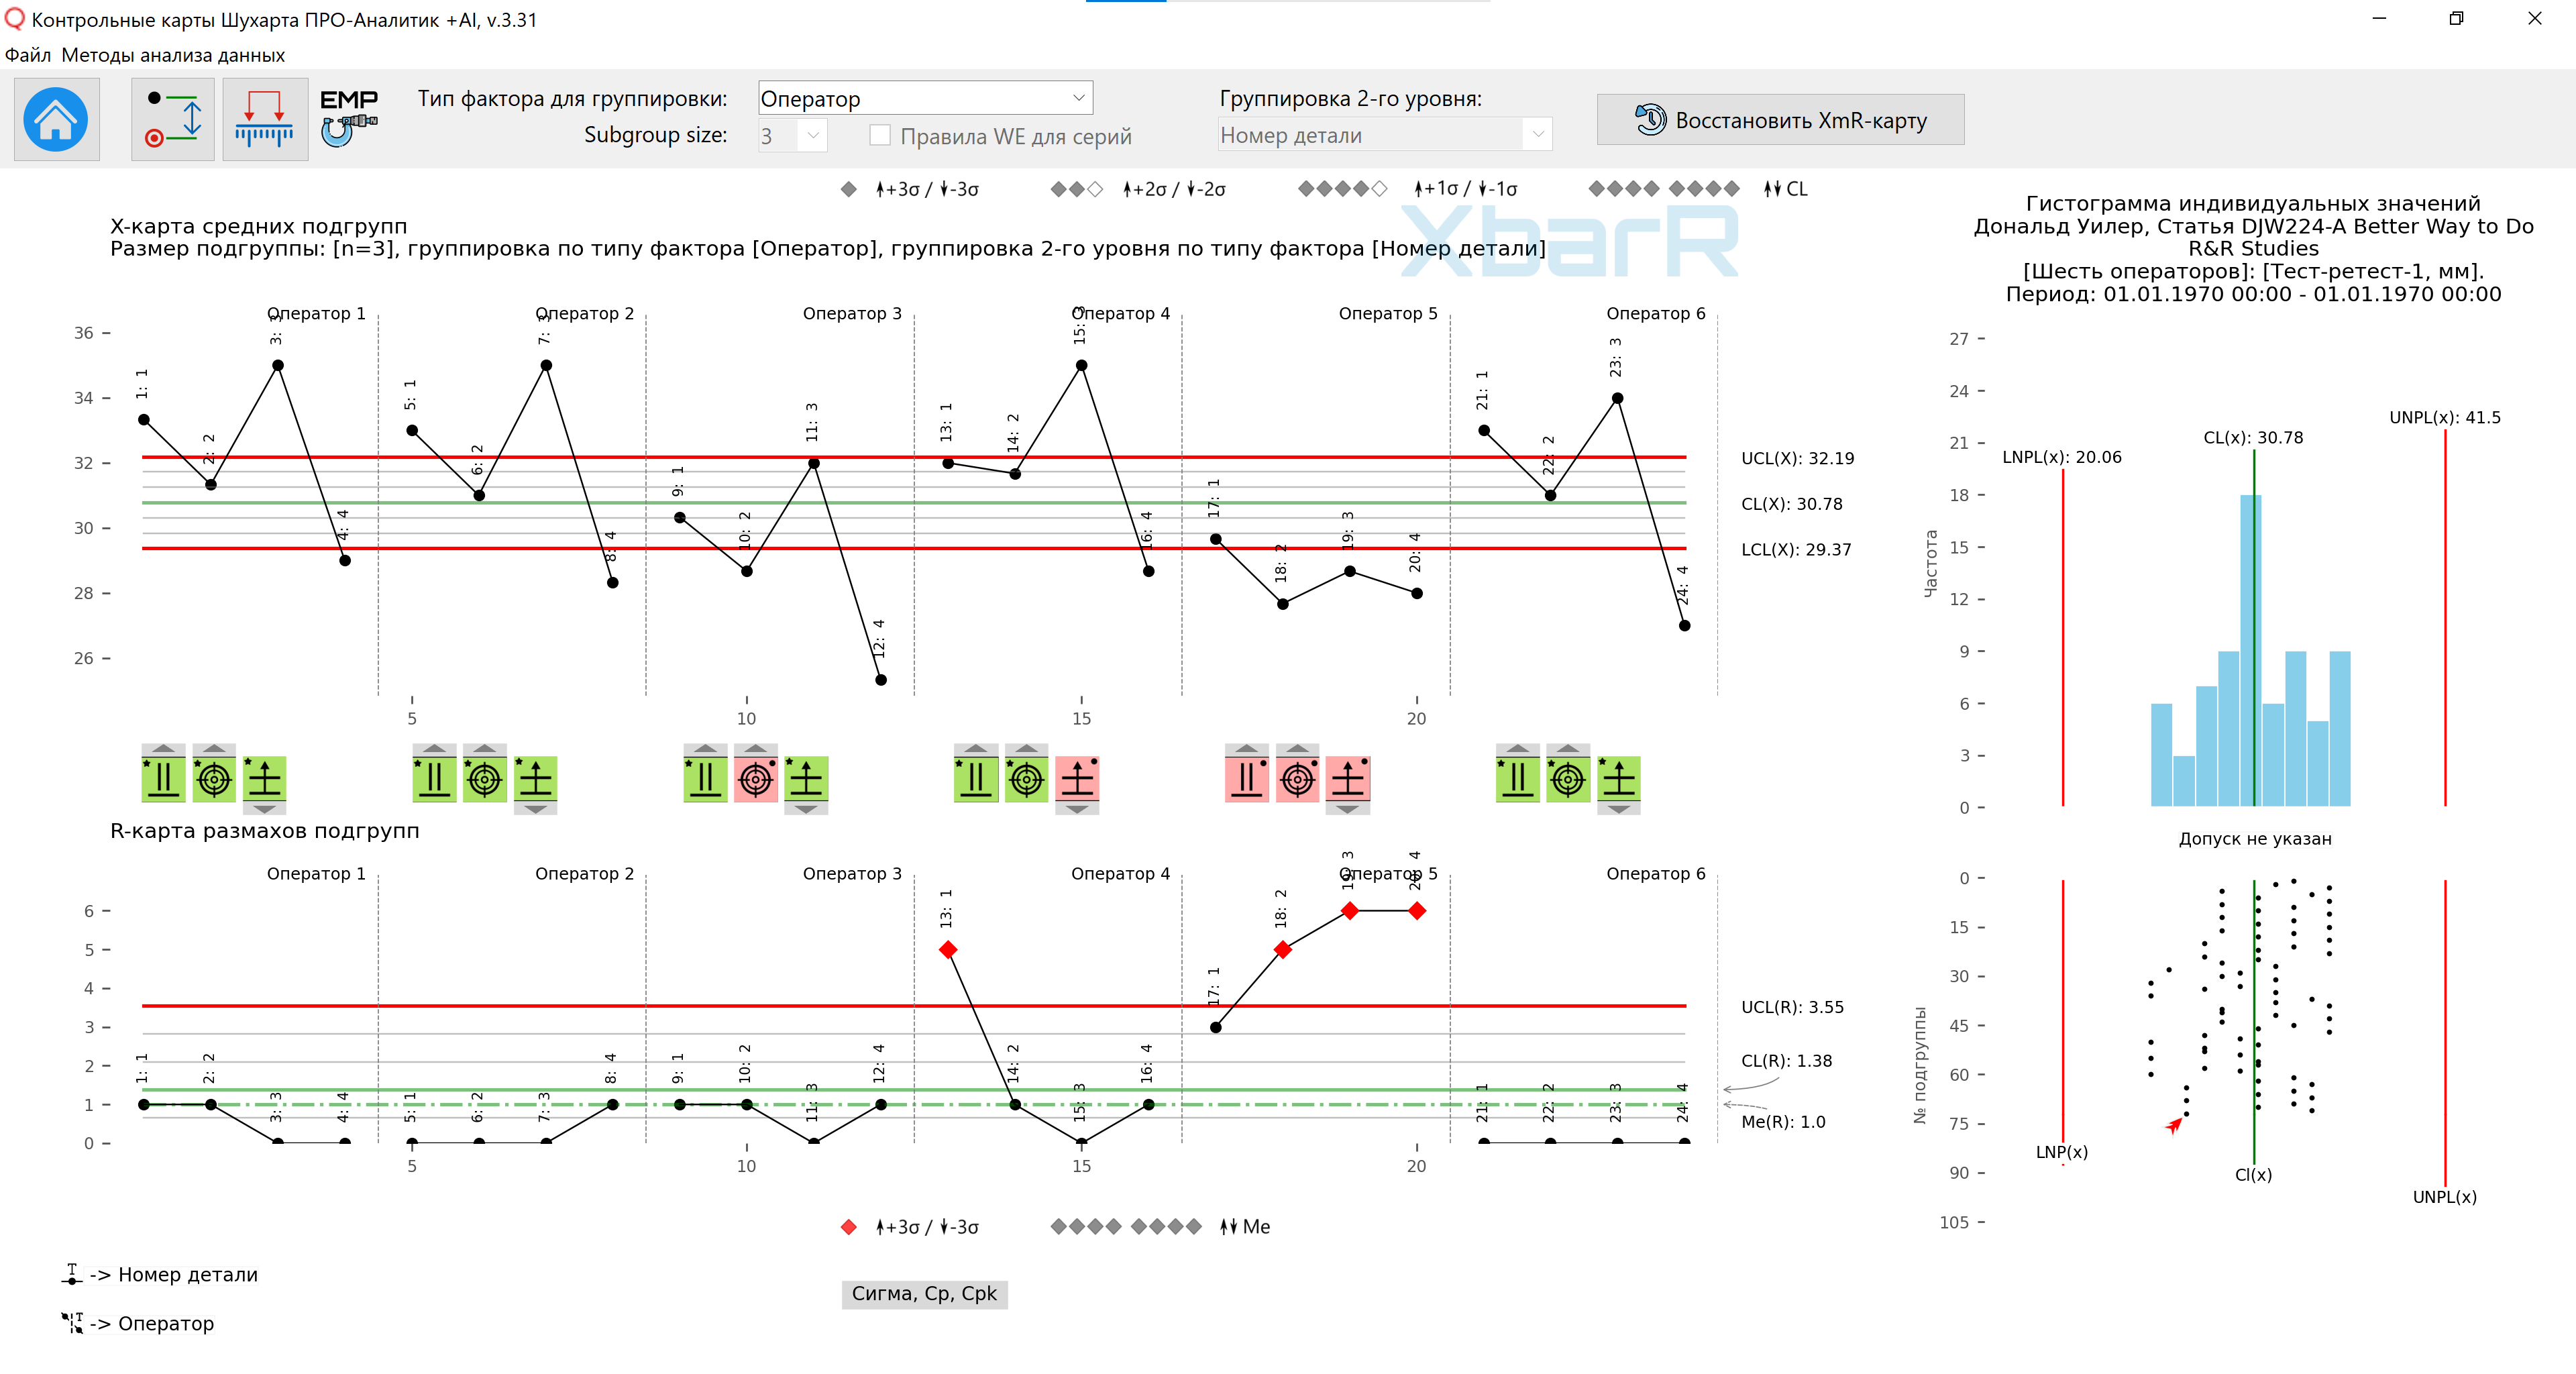
Figure 10. Organizing data into rational subgroups is also used in the function Evaluating the Measurement Process (EMP) with some difference.
Read Donald Wheeler's article Rational grouping of data for the XbarR-chart of averages and ranges of subgroups . In the article, control chart graphs of all ways of organizing data into subgroups are prepared using this feature of our software.
Video 1. Rational grouping of data to construct an XbarR-chart of means and ranges of subgroups by selected sources of variation and size of subgroups. Software “Shewhart control charts PRO-Analyst +AI (for Windows, Mac, Linux)”
Analysis of all data imported to construct Shewhart control charts begins with the construction of an XmR-chart of individual values and moving ranges. If the source data contains pre-grouped data for constructing an XbarR-chart of the means and ranges of subgroups, they undergo automatic ungrouping for the initial construction of an XmR-chart with the creation of new factor columns “No. Subgroup” and “No. (name) in the Subgroup”. After this, you can build an XbarR-chart of the averages and ranges of subgroups using the rational data grouping function. Firstly, this decision corresponds to a strong recommendation Donald Wheeler start data analysis by constructing an XmR-chart of individual values (process progress map), and secondly, this allows you to regroup the data by any type of factor (source of variation), records of which are present in the source data.
The Three-Way Chart
Source of methodology: Donald Wheeler's article "The Three-Way Chart (DONALD J. WHEELER, The Three-Way Chart)", www.qualitydigest.com
"If a product by weight is produced in batches, then there will certainly be variation from batch to batch. If the product within each batch is relatively homogeneous, then the variation from batch to batch may be many times greater than the variation within a single batch. If this happens, then a conventional control chart can do not give a real picture of the process under study.
The only way to be sure that the lot-to-lot variation is actually greater than the within-lot variation is to measure each one. This will require multiple measurements within the same batch. If a manufacturer is interested in studying variation within a batch, he must perform at least two measurements on it; if not, then one is sufficient.
The XmR-chart is the most convenient tool for describing data characterized as “one measurement per batch.” If there are several such measurements, a different approach is needed - a three-way control chart, which I developed in 1982."

Figure 11. Window of the rational data grouping function. The graph area displays an XmR-chart of individual values and sliding ranges for steel tensile strength data. The [Subgroups in Chronological Order] checkbox is checked "on", the series will not be divided along the vertical lines of the [Smelting Lot] factors, and the Western Electric zonal criteria rules for the series will be applied to the entire data series.

Figure 12. Window of the rational data grouping function. In the graph area, a control XbarR-chart of the averages and ranges of subgroups for data on the tensile strength of steel is displayed. In the [Subgroups in chronological order] checkbox there is a checkbox "enabled".

Figure 13. Window of the rational data grouping function. The graph area displays a Three-Way Chart for steel tensile strength data. In the [Subgroups in chronological order] checkbox there is a checkbox "enabled". In the checkbox for creating a Three-Way Chart, there is a checkbox “enabled”.
Legend: UCL(X) TW - Upper control limit of individual values of average subgroups (Upper Control Limit); CL(X) - Center Line; LCL(X) TW - Lower control limit of individual values of average subgroups (Lower Control Limit); UCL(mR_X) - Upper control limit of the moving ranges of average subgroups (Upper Control Limit); CL(mR_X) - Central line of moving ranges of average subgroups (Center Line); ME(mR_X) - Median line of moving ranges of average subgroups (Median Line); UCL(R) - Upper Control Limit; CL(R) - Central line of subgroup ranges (Center Line); Me(R) - Line of the median of the ranges of subgroups (Median Line); LCL(R) - Lower control limit of subgroup ranges (Lower Control Limit);