Western Electric Zonal Criteria for Shewhart control charts
![[Western Electric Zonal Criteria for Shewhart control charts] button](https://advanced-quality-tools.ru/images/buttons/RulesWesternElectric-15.png)
You can select any rules that apply to points on the control chart to be highlighted in red and shaped according to Western Electric zonal criteria .
![Button [Automatic update of graphs with Shewhart control charts]](https://advanced-quality-tools.ru/images/buttons/sqlite_autoplay.png)
This function is included in the list of parameters saved in the chart properties when saved in the list for automatic chart updates with a selected timeout or to quickly open them with updated data.
The process control limits (red top and bottom lines) in the figure below demonstrate the minimum achievable process potential if the specific causes of variability that clearly appear in the red dots are identified and eliminated.

Figure 1. Window with the main control panel. On the control XmR-chart of individual values and moving ranges, points are highlighted in red, indicating the presence of special reasons for the observed variations, in accordance with those recommended by Donald Wheeler Western Electric zonal criteria .

Figure 2. Push-button control panel with rule control buttons for Shewhart control charts. Tooltip when hovering the mouse over the Wester Electric zonal criteria button for the X-card.
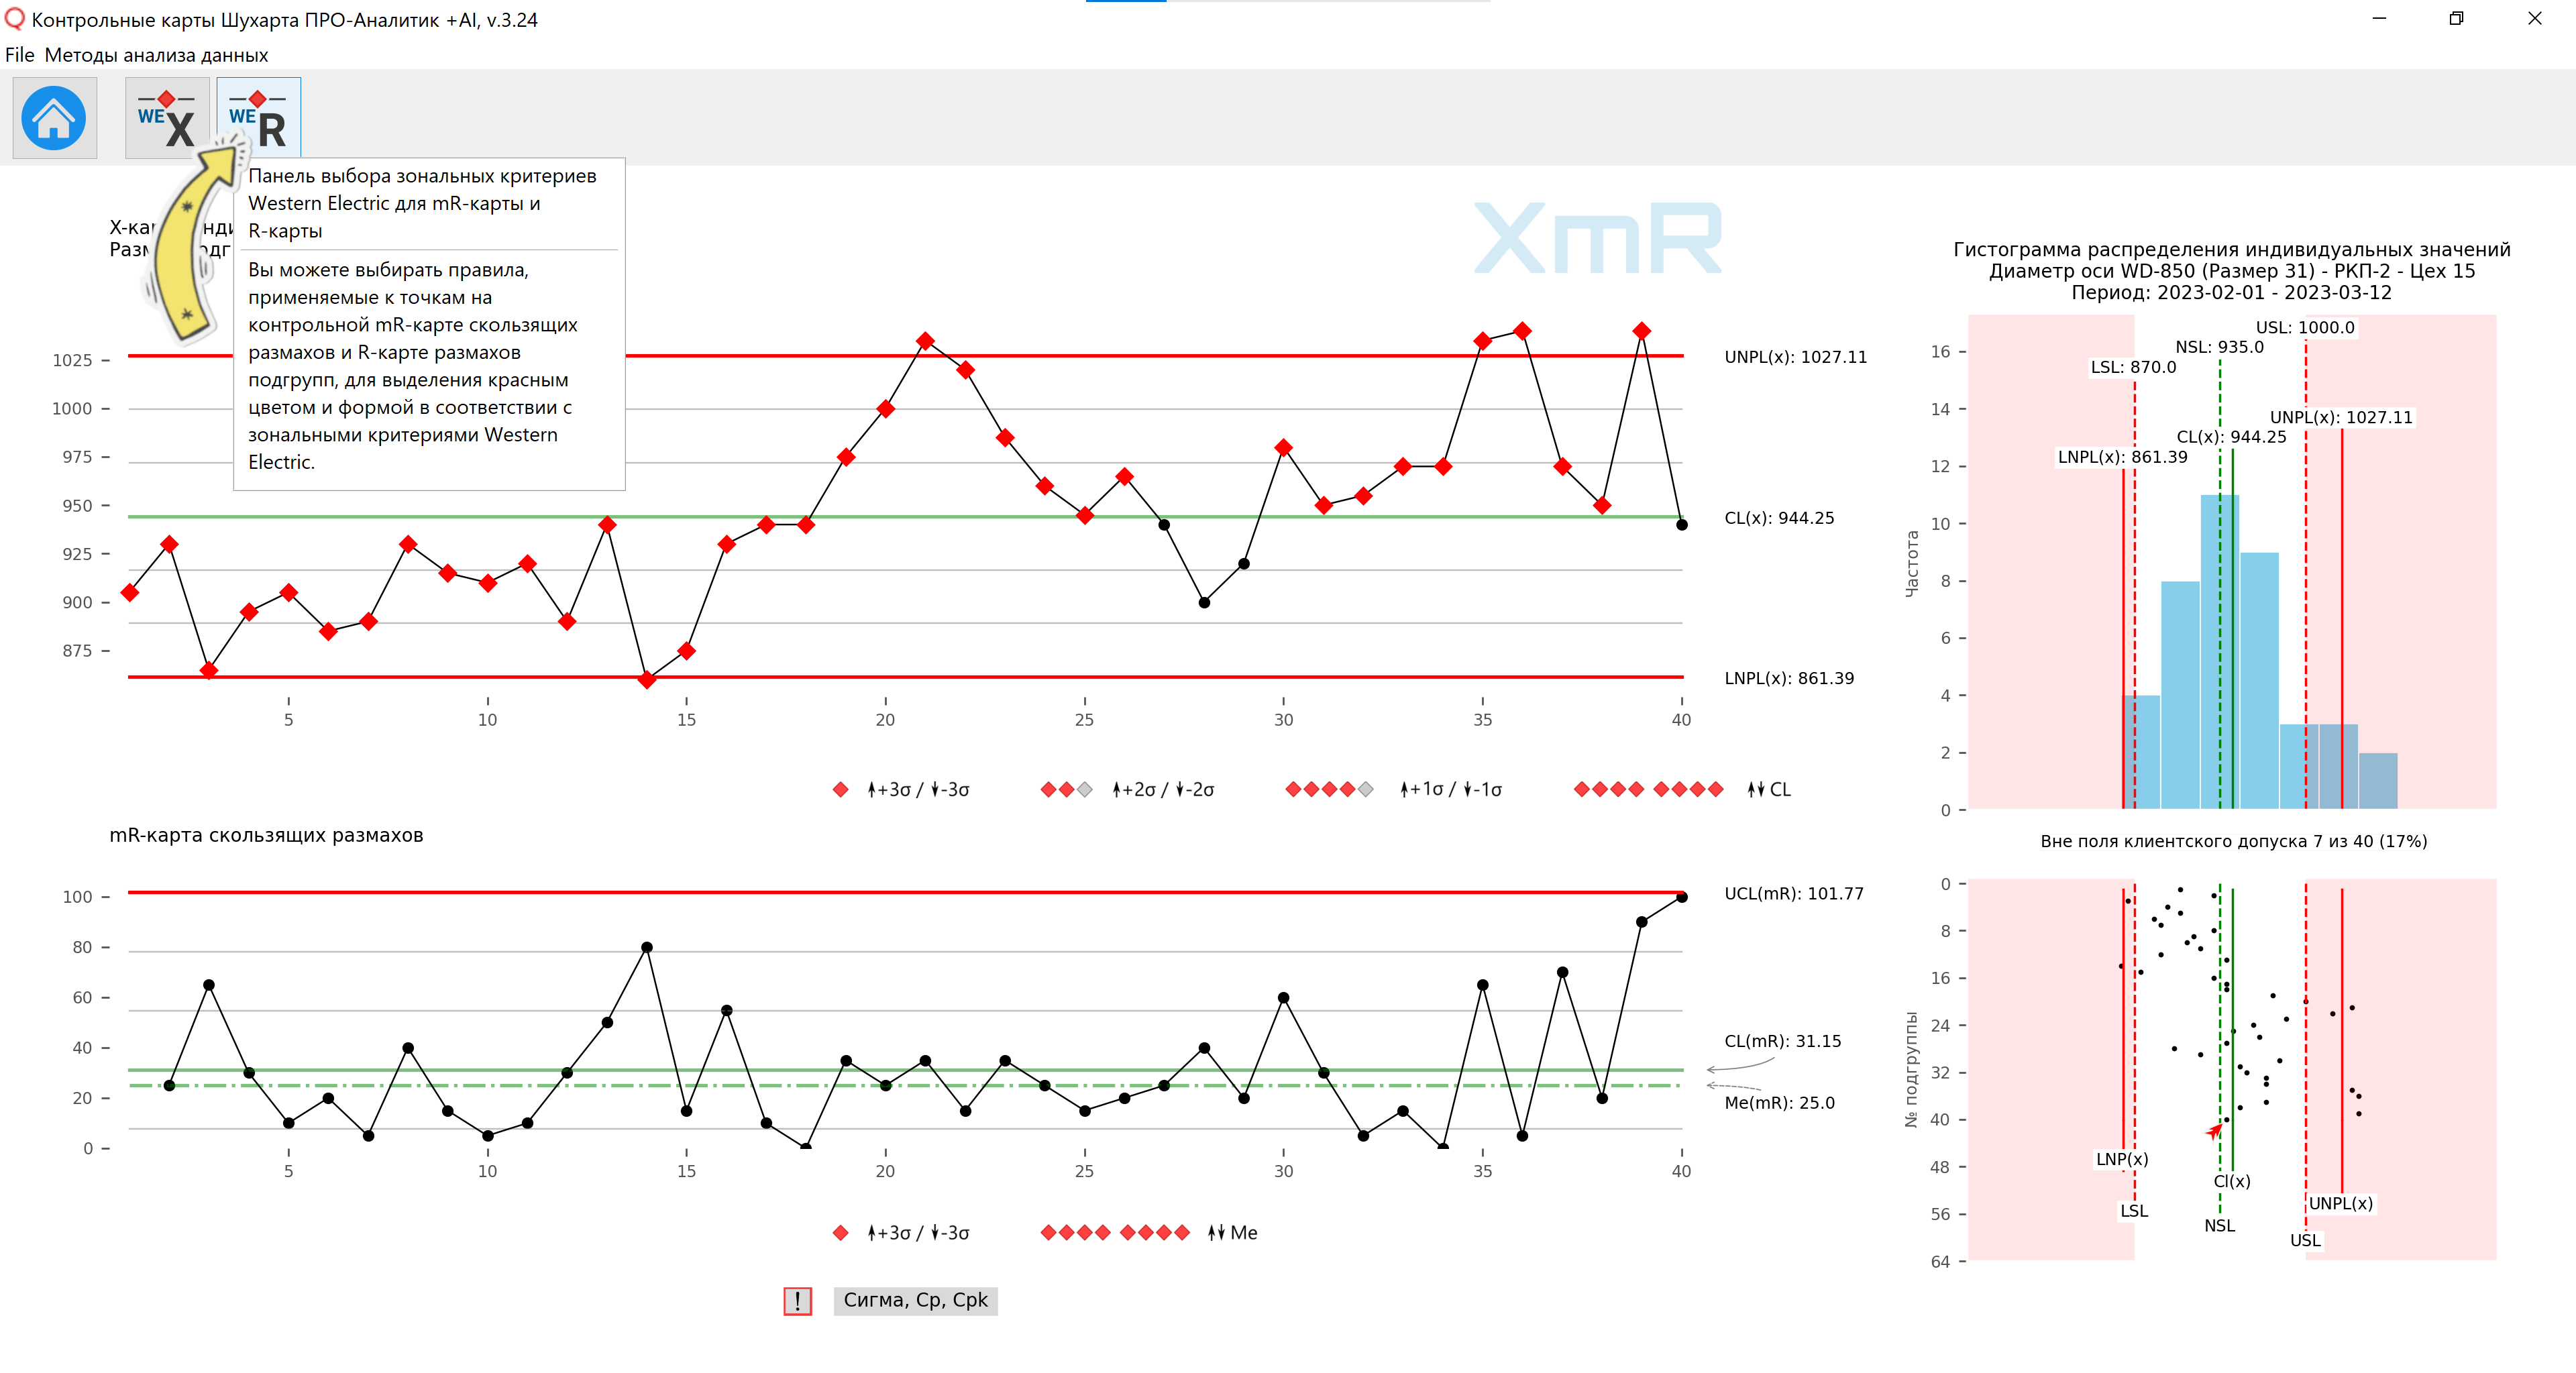
Figure 3. Push-button control panel with control buttons for the Rules for Shewhart control charts. Tooltip when hovering the mouse over the Wester Electric zonal criteria button for mR-map of moving ranges or R-map of subgroup ranges.

Figure 4. The panel for enabling/disabling Rules for the control X-map of individual values or Xbar-map of average subgroups is open. All four rules (Wester Electric zonal criteria) are included.

Figure 5. The panel for enabling/disabling rules for the control mR-map of moving ranges or R-map of subgroup ranges is open. All two rules (Wester Electric zonal criteria) are included.

Figure 6. The panel for enabling/disabling rules for the X-chart of individual values is open. All four rules (Wester Electric zone criteria) are disabled.

Figure 7. The panel for enabling/disabling rules for the X-chart of individual values is open. Only Rule 1 is enabled. A tooltip is displayed when you hover over the field named Rule 1 of Wester Electric Zonal Criteria.

Figure 8. The panel for enabling/disabling rules for the X-chart of individual values is open. Only Rule 2 is enabled. A tooltip is displayed when you hover over the field named Wester Electric Zonal Criteria Rule 2.

Figure 9. The panel for enabling/disabling rules for the X-chart of individual values is open. Only Rule 3 is enabled. A tooltip is displayed when you hover over the field named Wester Electric Zonal Criteria Rule 3.

Figure 10. The panel for enabling/disabling rules for the X-chart of individual values is open. Only Rule 4 is enabled. A tooltip is displayed when you hover over the field named Wester Electric Zonal Criteria Rule 4.
Control Form Conventions
For charts of individual values and subgroup averages

Rule - 1: At least 1 point above (3σ) or below (-3σ)

Rule - 2: In a series of 3 points, 2 points are above (2σ) or below (-2σ)

Rule - 3: In a series of 5 points, 4 points are above (1σ) or below (-1σ)

Rule - 4: Series of 8 or more points above or below the Center Line (CL)
For moving (mR) and group range (R) charts

Rule - 1: At least 1 point above (UCL) or below (LCL)

Rule - 4: Series of 8 or more points above or below the Median Me(mR)
Video 1. Software “Shewhart control charts PRO-Analyst +AI (for Windows, Mac, Linux)” (Zonal criteria of Western Electric)