Basic definitions of innovation management and statistical process control (Statistical Process Control, SPC)
Synergy
Synergy is the combined effect of factors, characterized by the fact that their combined effect significantly exceeds the effect of each individual component and their simple sum. A state of affairs usually conveyed by the phrase “the whole is greater than the sum of its parts”: 1+1=2x, where x>1.
Emergence
Emergence (English emergence - emergence, emergence of a new thing) in systems theory is the presence of special properties in any system that are not inherent in its subsystems and blocks, as well as in the sum of elements not connected by special system-forming connections; irreducibility of the properties of a system to the sum of the properties of its components; synonym: “systemic effect”.
Additivity
Additivity is a property of quantities in relation to addition, consisting in the fact that the value of a quantity corresponding to the whole object is equal to the sum of the values of quantities corresponding to its parts: 1+1=2.
Non-additivity
Non-additivity is the opposite of the concept of additivity, a relationship in which the whole is not determined by its parts and the whole cannot be known and explained on the basis of knowledge of its parts alone (the whole is greater or less than the sum of its parts): 1 + 1 = 2x, where x < or > 1.
“The inability of management to understand the interdependence between the components of the system, combined with management by objectives, causes great losses. The efforts of the various divisions of the company performing their work do not add up - they are interdependent. One division, in an effort to achieve its goals, can “kill” another division.”
Variability
Variability is variability, uncertainty, variety, spread, or a measure of deviation from the “optimum.” The change itself is called a variation or variant. See the article for details: Nature of Variability .
World class quality
"The concept of 'fine-tuning on target with minimal variance' has defined world-class quality for the last thirty years! And the sooner you make this principle the rule of your life, the faster you will become competitive!"
See description Taguchi loss functions , explaining this simple and succinct definition of world-class quality.
Statistical thinking
Statistical thinking is a method of making decisions based on the theory of variability about whether or not to intervene in a process, and if necessary, at what level.
“Firstly, if the output of a process is determined by the influence of special causes, then its behavior changes unpredictably and, thus, it is impossible to assess the effect of changes in design, training, component procurement policies, etc., which could be introduced by management into this process (or into the system that contains this process) for the purpose of improvement. While the process is in an uncontrolled state, no one can predict its capabilities.
Secondly, when special causes have been eliminated so that only the general causes of variation remain, then improvements can depend on control actions. Since in this case the observed variations of the system are determined by how and in what way the processes and the system were designed and built, then only management personnel, top managers have the authority to change the system and processes.
Well, what's the difference? And what does this give us? Yes, everything that separates success from failure!
Thirdly, we come to the problem that if we do not (in practice) distinguish one type of variability from another and act without understanding, not only will we not improve matters, we will certainly make things worse. It is clear that this will be so, and will remain a mystery to those who do not understand the nature of variability (variations)."
Reasonable degree of statistical controllability
“Since control charts are designed to detect the lack of statistical controllability, the constant presence of a process within the established boundaries can be considered an indicator of statistical controllability. If we, like Shewhart, consider the state of statistical controllability as a certain ideal, which in practice can only be approached, then before We will inevitably raise the question of a criterion that allows us to assess how close our process is to this ideal.
When applied to charts of means and ranges of a process that is described using subgroups consisting of four elements, Shewhart proposed the following criterion for minimum controllability: if at least 25 consecutive subgroups do not show signs of lack of statistical control, then such a process is considered to have a reasonable degree of controllability.
In his next proposal, Shewhart interprets this minimum criterion in terms of the total number of observations present, so it can be adapted as follows: when at least 100 consecutive observations show no loss of controllability, the process can be said to exhibit a reasonable degree of statistical controllability.
Proposing a criterion for minimal controllability, Shewhart emphasized that there is a fundamental difference between the absence of signs of uncontrollability and the conclusion that the process is in a state of statistical controllability. The absence of signs of uncontrollability can be explained by the peculiarities of the time interval described by the map.
Special causes may come and go, and relatively short periods of observation may not reveal points outside the control limits. However, the more observations accumulate that do not reveal the presence of any special causes, the greater the confidence that the process is in a state of statistical control. Shewhart also noted that one can be practically confident in the controllability of a process when not 100, but 1000 consecutive measurements do not reveal a lack of controllability."
“A phenomenon should be called controllable when, using past experience, we can predict, at least within some limits, what variations of it can be expected in the future.”
Scientific approach and theory of knowledge of something
Cycle of the scientific approach: Study of observed phenomena - development of a theory (assumption) that explains the observation and operational definitions - prediction of the further behavior of phenomena on the basis of the developed theory, taking into account the limits of applicability - checking the compliance of the next observation with the developed theory - confirmation of the theory or its adjustment, or maybe a complete rejection for development of a new theory.
An excerpt from Edwards Deming's System of Deep Knowledge (Elements of the Theory of Knowledge), which is directly related to the essence of the scientific approach:
- No number of examples creates a theory. But at least one failure in a theory requires its revision or even abandonment.
- Almost every management action requires prediction.
- A statement that does not contain a prediction is of no use to a leader.
- By definition, prediction is impossible in an unstable system.
- Interpretation of data from a test or experiment is a prediction.
- Importance operational definitions , which give concepts meaning that can be conveyed to others.
- There is no true value of any characteristic, state, or condition that is determined through measurement or observation.
The scientific approach encourages us to make decisions and formulate policies based on good information, both quantitative and qualitative, and not just on the basis of self-perceptions or short-term considerations. It often involves analyzing information using statistical methods (Statistical Process Control, SPC), but also involves knowledge and understanding of the limitations of these methods, especially an awareness of the critical importance of phenomena that cannot be described numerically. Deming often quotes Lloyd Nelson, head of the statistical methods department at Nashua Corporation:
“The most important factors needed to manage any organization are usually unknown and cannot be quantified.”
Unscientific
An important sign of unscientificness is the lack of predictive power.
“The theory of knowledge teaches us that any statement carries knowledge when it is capable of predicting future results and corresponds to past experience without any exception.”
Error of the first type (overregulation)
Error of the first type (overregulation) is the interpretation of the general causes of variations as special, and as a result, a reaction to any event that goes beyond the tolerance limits or does not achieve the set goal, in the form of an external corrective action (interference in the operation of the system), introducing even greater variability.
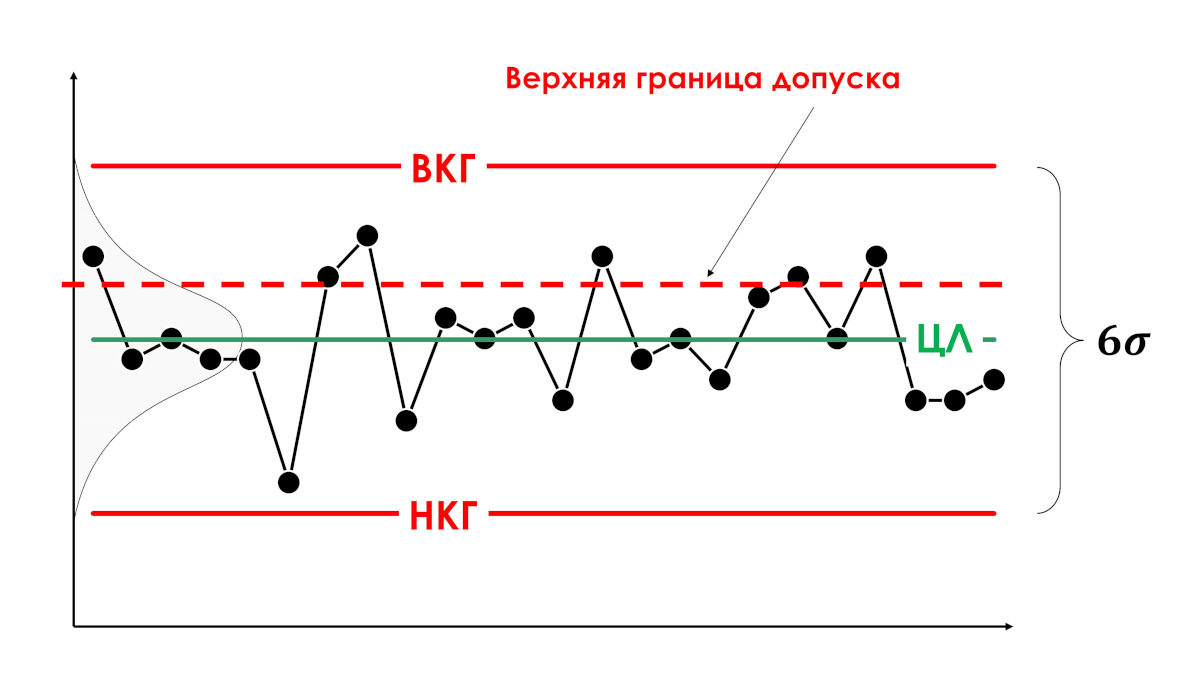
Drawing. Error of the first type (overregulation)
Error of the second type (insufficient process control)
Error of the second type (insufficient process control) - judgments about the potential capabilities of a process that is in a statistically uncontrollable (uncontrolled) state, because such judgments can only be applied to processes with a dominance of common causes of variation, i.e., those that are in a statistically controlled state. Failure to take measures to eliminate special causes if the variations caused by them fit within the tolerance limits.
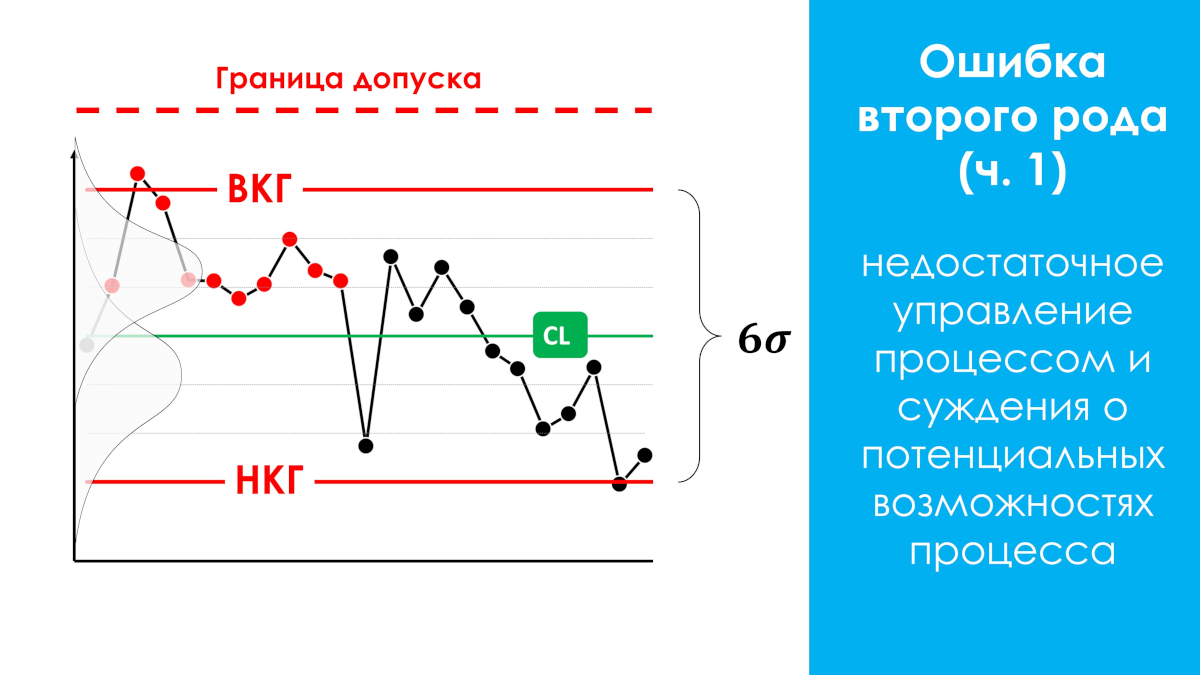
Drawing. Error of the second type (insufficient control)
“Both mistakes are very costly! Anyone can make an impeccable rule for themselves never to make a mistake of the 1st type.
It's simple: all you have to do is connect the variation in all cases with common causes. However, this maximizes losses from committing a type 2 error. And vice versa, by refusing to commit a type 2 error by attributing any variation to special causes, we increase the losses from a type 1 error.
It would be great to never make mistakes of either the first or second type, but, unfortunately, this is impossible. Shewhart set a completely different goal: not to be afraid of making both types of errors, but to regulate the frequency of these errors in such a way as to minimize the economic losses from both. As a result, he created a tool - a control chart with boundaries at the 3x sigma level. Since then, his control chart has produced astonishing results in a wide variety of application areas. It really works!
Statistical control can be achieved by hunting for each specific cause and identifying it whenever a point falls outside the control limits and taking appropriate action."
Error of the second type, a special case (night blindness). Occurs most often.
If the process producing a product that is defective relative to the tolerance limits is in a statistically uncontrollable state (see figure below), intervening in the process when some values are outside the tolerance limits may have some positive effect on the process output, but is always ineffective (effort -result), since there is a high probability of missing special causes of uncontrollability, which could be identified by the Shewhart control chart at points, but are located within the tolerance zone, which leads to “night blindness” of observers - failure to use additional opportunities to improve the process.
Night blindness is the most common phenomenon. This special case of a type II error has not previously been separately explained in foreign and Russian scientific sources. In 2021, a description was given and a name was given to this special case by the scientific director of our AQT center S.P. Grigoryev.
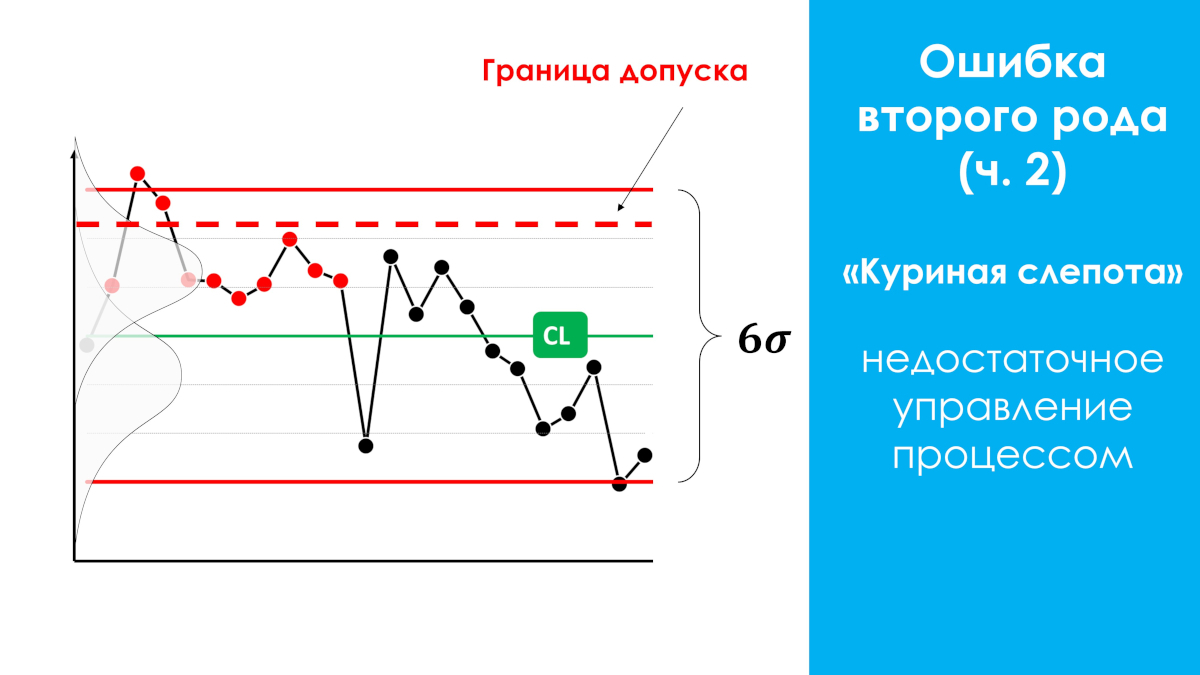
Drawing. Type II error, special case (night blindness)
Taguchi quality loss function
Japanese scientist Genichi Taguchi proposed a new approach to assessing the quality of products. The traditional idea of product quality is that all manufactured products are of equal quality if their quality indicators (or parameters) meet the requirements of the technical documentation, which defines the tolerance for these indicators (parameters). In other words, within the tolerance zone, quality losses are zero. If the quality indicators go beyond the tolerance limits (LSL) and (USL), then the quality losses are declared unacceptable. Taguchi called this quality loss function (see the figure below, a broken straight line) a “discontinuous threshold-like function.”
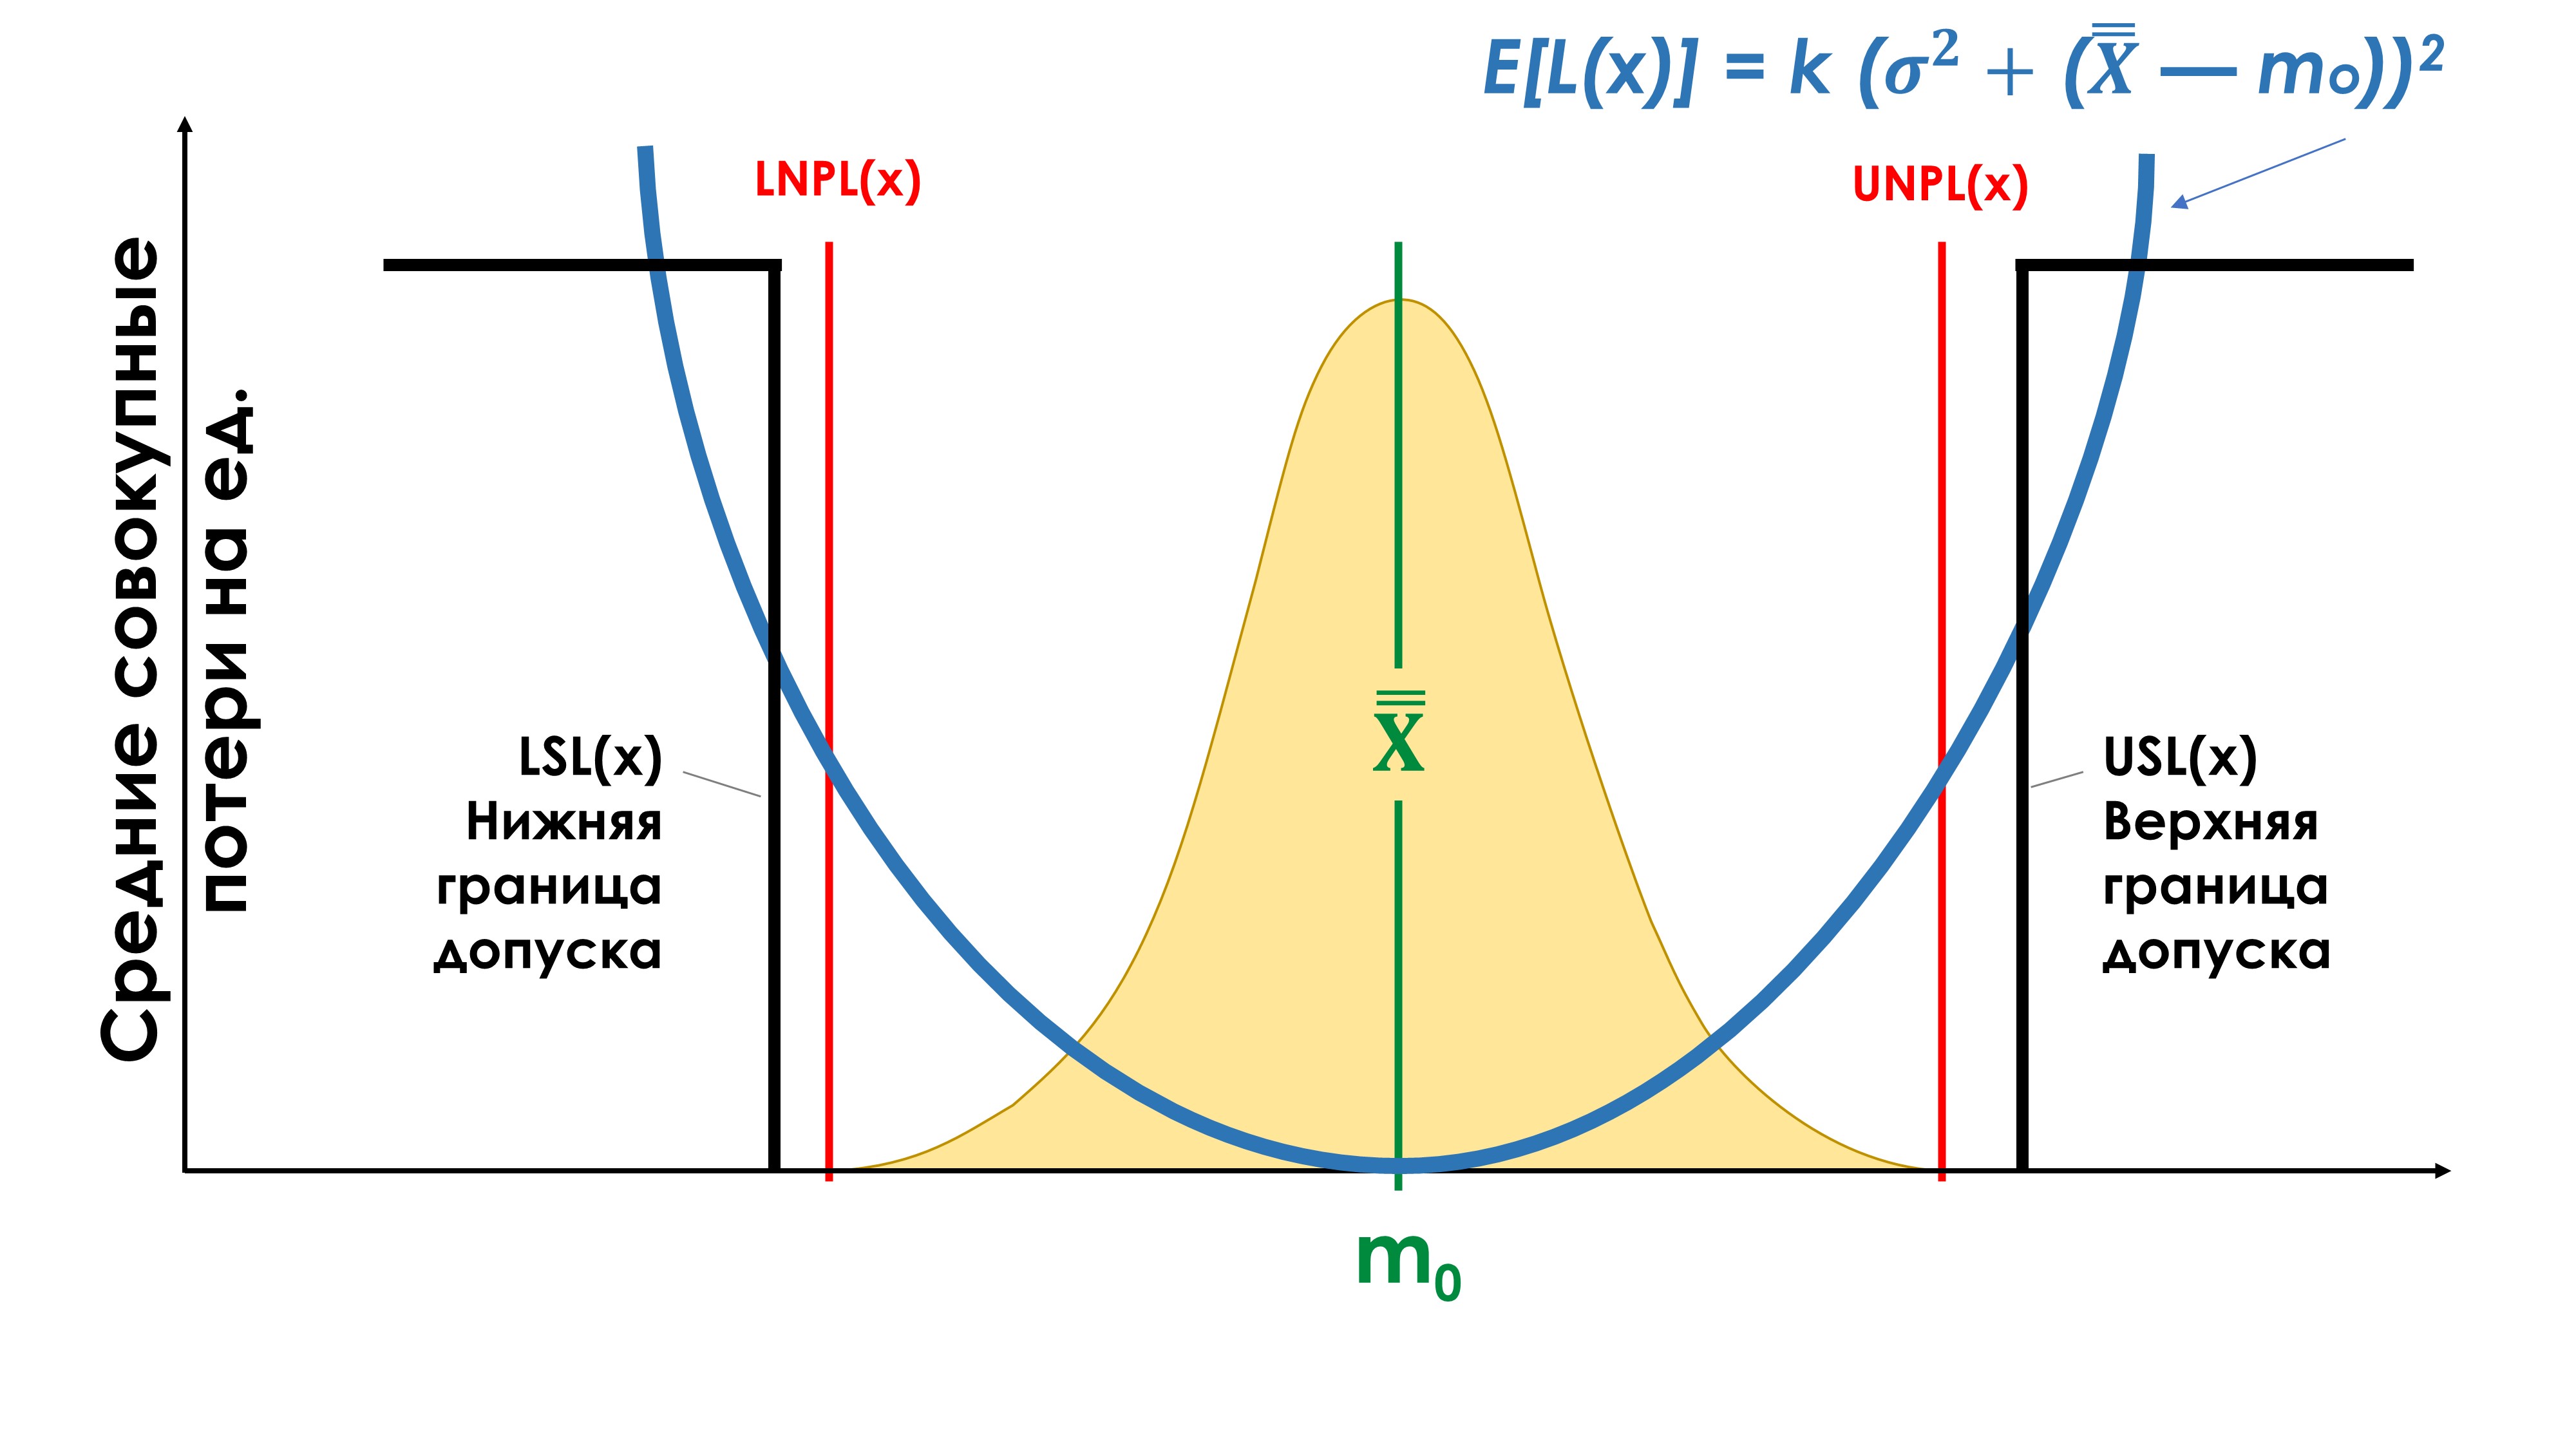
"It is clear from Taguchi's function that meeting tolerance requirements is by no means a sufficient criterion by which to judge quality. The attempt to do so is in clear contradiction with the insistence on continuous improvement, one of the fundamental in Deming's philosophy. Indeed, the last of approaches are characterized by a constant search in the direction of improving quality, while the first does not provide any incentive to work better, as soon as the tolerance requirements have already been satisfied.
In contrast, the underlying ethic of some established approaches to quality, including cost-of-quality methodologies, tends to discourage further improvement efforts on the basis that if customer needs have been satisfied, further investment of time, effort and expense in that particular process is not justified. ".
“The use of tolerances (specifications, technical specifications, technical specifications) is not a mistake. It’s just not enough.”
"Dr. Taguchi's concept, based on loss function analysis, inevitably leads to a new definition of world-class quality: just on target with minimal variance! The first requirement - 'just on target' - means that the process mean is set so that that it is as close to the target (nominal) as possible. The second requirement, “minimum variance,” means that the process must have a reasonable degree of statistical control.
Failure to comply with the principle of “in accordance with the goal with minimal variance” will inevitably lead to a significant increase in average losses per unit of production. These losses can be very serious, but are always unnecessary.
“Tolerance Compliance,” “Zero Defects,” “Six Sigma Quality,” “Cost of Quality,” and all other tolerance-based drugs simply cannot satisfy this principle. The concept of “fine-tuning to target with minimal variance” has defined world-class quality for the last thirty years! And the sooner you make this principle the main law of your life, the faster you will become competitive!”
The application of the approach to quality resulting from the Taguchi function should be applied when using any other quality indicators with boundaries “from” and “to”, for example, delivery times under the contract, etc.
Measuring system
A measuring system is the result of the interaction between the measuring instrument used, the measuring method, the environment and the operator.
Each machine operator who measures a part during its manufacture is part of his own measuring system, which has its own uncertainty (variability, error), bias and can be in a statistically controlled (stable) or uncontrolled (unpredictable) state. A measurement system that is in a statistically uncontrollable state is useless. The controllers' measuring system is another measuring system. When the operator submits his products for inspection, he determines their compliance with tolerances through his unique measurement system. Evaluation and consistency of measurement systems must be carried out before monitoring work processes.
Have you agreed on your measurement systems with your suppliers and customers?
Genichi Taguchi
Genichi Taguchi (born in 1924) is a well-known Japanese statistician in the second half of the 20th century. He develops the ideas of mathematical statistics, relating in particular to statistical methods of experimental design and quality control. Taguchi was the first to connect economic costs and quality with a mathematical relationship, introducing the concept quality loss functions . He was the first to show that quality losses also occur within the tolerance range.
In our opinion, inattention to Taguchi’s methods is one of the reasons for the serious lag of Russian enterprises in the field of improving the quality of processes and products.
Peter Scholtes
Peter Scholtes (1938-2009), one of the most famous consultants and educator in the field of quality management methods in the West, developing the ideas of Dr. Deming. Read the chapter: The "management by objectives" method - what's wrong? from the book “Team Handbook” by Peter Scholtes [7].
Peter Scholtes website: www.pscholtes.com
Walter Andrew Shewhart
Walter Andrew Shewhart (Walter A Shewhart, 1891-1967), born in New Canton, pc. Illinois in 1891. Graduated from the University of Illinois. Later he received a doctorate in physics from the University of California (1917).
In 1931, Shewhart published a report on the use of control charts and his first book, Economic Management of Industrial Quality. 1939 became a special date in the biography of Professor Shewhart of Rutgers University. Then his second book [9] “Statistical method from the point of view of quality control” was published. At the end of the decade, Shewhart summarized the results of work on the statistical method of monitoring the quality of production and technological processes and ensuring, on this basis, the quality of manufactured products. Edwards Deming's first teacher and oldest friend.
Donald J. Wheeler
Donald J. Wheeler is a consulting statistician who was fortunate to work with David Chambers from 1970 to 1989.
Since 1971, Wheeler has taught statistical process control, first to students at the University of Tennessee, then to industrial managers around the world.
Since the mid-1970s he has worked actively as a consultant.
In 1974, Donald Wheeler attended Dr. Deming's lectures for the first time and remained his student forever.
Beginning in 1981, he sometimes assisted Edwards Deming in conducting his four-day seminars. His own philosophy of process improvement rests firmly on Deming's philosophy. Donald Wheeler is the author or co-author of six books and more than 60 articles on statistical process control.
He had the opportunity to work with a wide variety of industrial enterprises around the world. He lectures both in the United States and abroad.
Donald Wheeler received his BA in physics and mathematics from the University of Texas at Austin and his MS and PhD from Southern Methodist University.
From 1970 to 1982, he taught in the statistics department at the University of Tennessee. In 1982, Wheeler left teaching to focus on consulting in industry and other areas. Donald Wheeler currently lives in Knoxville, Tennessee.
Dr. Donald J. Wheeler is a Fellow of the American Statistical Association and the American Society for Quality, a 2010 Deming Medal recipient, and is one of the world's leading authorities on statistical process control and applied data analysis.
Co-author of a bestselling book [4] "Statistical process control. Business optimization using Shewhart control charts" / "Understanding Statistical Process Control". From Edwards Deming's foreword to that book:
“It is a great honor for me to write the foreword to my friend Dr. Donald Wheeler’s book.
...
In conclusion, I would like to take this opportunity to commend Dr. Wheeler's mathematical achievements. His understanding of theory and practice is based on a deep understanding of mathematics. And I'm happy to have the opportunity to learn from him."
Donald Wheeler, the author of many articles in scientific publications on the use of Shewhart control charts in industry, he kindly provided us with some of them, and we translated them into Russian and posted them on our website in the section:
fundamental knowledge
.
List of original articles:
[9], [19], [20], [21], [25], [26], [29], [31], [33], [34], [35]
- Donald Wheeler.
David S. Chambers
David S. Chambers (1917-1989) was a close friend and colleague of Dr. William Edwards Deming and an internationally renowned consultant and teacher of statistical process control.
He was a member, president and chairman of the board of the American Society for Quality Control (ASQC), a Eugene Grant Award recipient, and an academician of the International Academy of Quality. A list of his colleagues and former students could easily serve as a Who's Who? in the field of quality control.
David Chambers was born in Clarksville, Texas. He earned his bachelor's and master's degrees from the University of Texas, where he taught from 1941 to 1947 before becoming an assistant professor of statistics at Tennessee State University. Here he worked as a professor of statistics from 1958 to 1981, after which he retired, which allowed him to concentrate on teaching. According to Dr. Deming, the loss of such a person is irreplaceable.
Myron Tribus
Myron Tribus, director of Exergy, split his time between Exergy Corporation, a company that pioneers new approaches to power generation, and work as a quality management consultant.
With thirty years of experience as a teacher, he also served as Assistant Secretary for Science and Technology at the U.S. Department of Commerce.
He was senior vice president at Xerox Corporation and director of the Center for Engineering Excellence. Myron Trybus was a follower of Dr. Edwards Deming. Read the article by Myron Trybus Viral theory of management where he draws an analogy with 19th (19th) century medicine and 20th (20th) century management to illustrate why society adheres to dominant paradigms and resists change in order to improve our lives.
Henry R. Neave
Henry R. Neave. Dr. Henry Neave met Edwards Deming in the mid-1980s and immediately became his close friend. Since then he has continually assisted Deming in his four-day seminars in Europe, as well as in other seminars, conferences and events held on both sides of the Atlantic.
It was Deming who encouraged Neave, as a recognized expert in Deming's philosophy, to take up the book [1] "Dr. Deming's Space: Principles for Building a Sustainable Business." Edwards Deming himself wrote the foreword to this book.
It is better to start studying Edwards Deming's management theory with this book.
In 1987, it was on the initiative of Dr. Neave that the British Deming Association was organized, in which Neave now holds the position of director of education. For many years, Dr. Neave taught statistics at the University of Nottingham in England. Since 1996 he has been a full-time lecturer in management in the Department of Quality at Trent University, Nottingham.
Alfie Kohn
Alfie Kohn is an internationally renowned social psychologist. See on our website materials prepared using the works of Alfie Kohn in the articles: Personnel motivation system , The Misguided Appeal of Competition .
Alfie Kohn's personal website: www.alfiekohn.org