Analysis of measuring systems: error; bias; effective increment; Evaluating the Measurement Process (EMP)
![[Measurement System Analysis] button](https://advanced-quality-tools.ru/images/buttons/Measurement_system-15.png)
Measuring system , it is the result of the interaction of the measuring instrument used, the measurement method, the environment and the specific operator making the measurement.
Random measurement error occurs due to unpredictable factors and its magnitude and direction may differ from measurement to measurement.
Systematic measurement error (bias) is an error that occurs every time a measurement is made and is always biased in the same direction.
“A measuring system cannot be regarded in any logical sense as measuring anything at all until it has achieved a state of statistical control.”
Error estimation of a stable measuring system
"You cannot use measurements to confirm that a product meets a tolerance until the specified tolerance exceeds 5 or 6 probable measurement system errors (0.675 * σ meas.system )".
When do you need to know and account for the error in your measurement systems?
- If you measure something to control sizes and calculations.
- If you have to grade products relative to tolerance limits, you will have to account for the uncertainty associated with the error of your measuring system (σ meas.system ), at least because of the possibility of financial and legal consequences in the event of a justified refusal by consumers to refuse your supplies.
“Probable error (0.675 * σ meas.system ) characterizes the variation that can only be attributed to the measurement process. To obtain this value, it is necessary to obtain some data that can isolate measurement error from other sources of variation. A simple way to do this is to make parallel measurements on the same sample, using the same methods, with the same instrument and with the same operator.”
Estimation of the error of the measuring system (σ meas.system ) using a standard
When you have a known standard (benchmark) error assessment and offsets (see below) measuring system is not particularly difficult. To do this, you need to carry out at least 25 repeated measurements (test-retest) of the standard and plot the obtained values on the XmR control chart of individual values and sliding ranges. If the control chart demonstrates a statistically stable state (stability), the resulting value of one sigma (σ) will be the error of your measurement system. Obtained based on (σ meas.system ) of the measuring system, the probable error of the measuring system, equal to (0.675 * σ meas.system ) should be used to select effective increment when recording individual measurements obtained using this measuring system and calculating production tight tolerances . Otherwise, if the control XmR card demonstrates a statistically unstable state, your measuring system is more like a “rubber ruler” (D. Wheeler) and the values obtained using it should not be trusted. Find special reasons that cause the measuring system to become unstable and eliminate them; otherwise, stop using the measuring system.

Figure 1. Twenty-five repeated measurement (test-retest) values of the reference are plotted on an XmR reference chart of individual values and sliding ranges. The measuring system confirmed a statistically stable state.
Estimation of the error of the measuring system (σ meas.system ) without standard
If you don't have a standard, you can use 25 repeated test-retest measurements of the same sample and plot them on an XmR control chart of individual values and sliding ranges. If the XmR control card demonstrates a statistically stable state of your measurement system, you can use the average of all test-retest tests as the “best value” of the sample being measured, and the sigma of such a process as the error of the measurement system. But to measure offsets (see below) The measuring system will require more accurate measuring equipment, if possible, to make 25 repeated test-retest measurements of your sample, and if the data obtained demonstrate a statistically stable state, the resulting average value of such measurements can be taken as a reference value and the bias can be estimated from it .
Estimation of the error of the measuring system (σ meas.system ) for destructive testing.
In this case, you will have to use the XbarR control chart of subgroup means and ranges to measure pairs of samples that are as similar as possible to each other, combining the measurements of such samples into one subgroup (n=2). The calculated Sigma (σ) value of the individual values (not the Sigma of the subgroup averages) will then demonstrate the error of your measurement system when measuring single samples from the product stream. In our software, when constructing an XbarR-chart of the averages and ranges of subgroups, the calculated sigma of individual values is displayed under the graphs of the control chart.
“In the case of destructive testing, when it is impossible to homogenize samples in advance, it is necessary to select pairs of samples that are as similar as possible to each other, test these pairs and evaluate the differences between such paired measurements.”
In Figure (2) below, we show an example of constructing an XbarR mean chart to determine the stability and error of a measurement system (MS) for destructive testing. Additionally, the Xbar average control chart demonstrates the relative usefulness of the measurement system for evaluating the process from which paired samples are taken, at least over a period of time equal to that during which the destructive test samples were taken. The control limits on the Xbar chart show the amount of variation that can only be attributed to measurement error. For an explanation of the latter, check out Donald Wheeler's article: Evaluating the Measurement Process (EMP).

Figure 2. Forty values of destructive measurements of samples are combined into 20 subgroups of size n=2 to localize measurement error between two similar samples. The measurement system confirmed the stability of the error in the R-map of subgroup ranges while simultaneously demonstrating the inadequacy of this measurement system for tracking variations in the process from which samples were taken for destructive testing (only 3 points out of 20 were above the control limits on the Xbar map). In this case, the more points on this X-map of subgroup averages that fall outside the control limits, the better the measurement system.
Checking the displacement of the measuring system detected by the Shewhart control chart
The function of checking the displacement detected by the control card of the measuring system, which is in a statistically controlled state, informs when it is really worth thinking about tuning it. And the methodology for detecting displacement of the measuring system is operational definition this displacement.
But if you have to sort products relative to pass/fail tolerance limits using a biased measuring system, and completely unbiased systems do not exist in the real world, you can use the function of working with production narrowed and shifted tolerances to obtain a compensating offset tolerance for the offset value of the measuring system in a statistically stable state.
Do not forget to coordinate the offset and error of your company's measuring systems, which are used to carry out incoming inspection and verification of shipped products, with these properties of the measuring systems of your suppliers and consumers. Again, these parameters make sense only for measuring systems that are in a statistically controlled state (stable state).
The bias of a measurement system is defined as the difference between the average value [CL(x)] of 25-30 test-retest measurements of the same standard (standard) and the value of this standard, provided that the measurement system being evaluated is statistically robust.
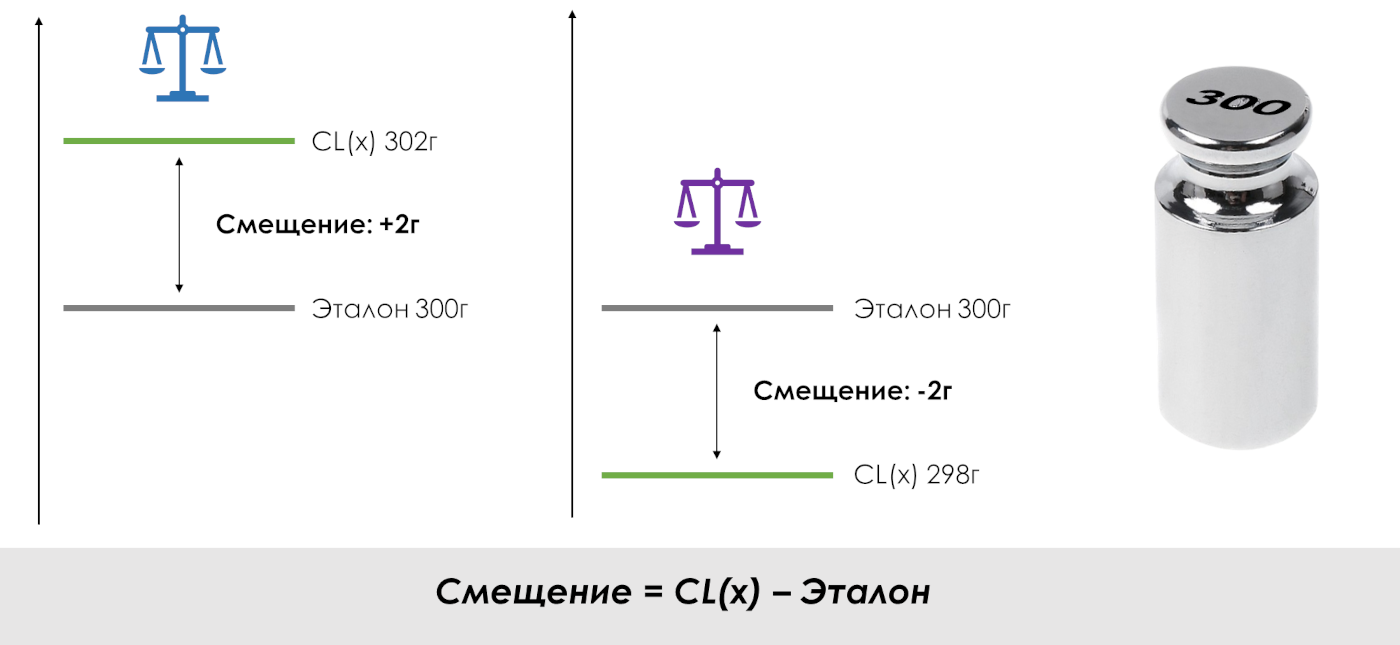
Rice. 3. What is the offset of the measuring system.
Below are screenshots of the screen using the software function to determine the offset of the measuring system detected by the Shewhart control card.

Figure 4. Button to go to the measurement system (MS) evaluation control panel. Software "Shewhart control charts PRO-Analyst +AI (for Windows, Mac, Linux)".

Figure 5. Control panel for measurement system evaluation functions. The button for going to the control panel for estimating the displacement of the measuring system (MS) is highlighted. Software "Shewhart control charts PRO-Analyst +AI (for Windows, Mac, Linux)".
“A simple way to graphically check the significance of a measurement system offset is to move the center line and control limits for the XmR-chart of individual values so that the center line is at the value of the standard (reference) used in test-retest tests (multiple measurements of the same and the same standard). If shifting the Center Line (CL) and Control Limits (UNPL, LNPL) relative to a series of data does not result in signals (red dots) outside these limits and any long series above or below the center line, or any other signals, then there is no detectable offset in the measuring system.”

Figure 6. Control panel for measuring system displacement estimation. A control XmR-chart of individual values was constructed based on test-retest test data of the Measuring System. The button to start assessing the detectability of the displacement of the measuring system (MS) is highlighted, and the [Value of the standard used] field is filled in. Software "Shewhart control charts PRO-Analyst +AI (for Windows, Mac, Linux)".

Figure 7. Control panel for measuring system displacement estimation. The result of detecting the displacement of the measuring system is that the displacement is detected. Software Shewhart control charts PRO-Analyst +AI.
In Figure 7 (above), the check detected a significant displacement of the measuring system in the form of signals (red dots) after the center line was shifted to the value of the measured standard and the control limits were shifted parallel to the center line. The graph of the data series remains in place.
Below is another case where the control chart did not detect any significant misalignment of the Measurement System.

Figure 8. Control panel for measuring system displacement estimation. Initial control chart before a measurement system offset detection test for another measurement system. Software "Shewhart control charts PRO-Analyst +AI (for Windows, Mac, Linux)".

Figure 9. Control panel for measuring system displacement estimation. The result of detecting a displacement of the measuring system is that no displacement was detected. Software Shewhart control charts PRO-Analyst +AI.
Each machine operator who measures a part during its manufacture is part of his own measurement system, which has its own uncertainty (error), bias and which can be in a statistically controlled (stable) or uncontrolled (unpredictable) state. The controllers' measurement system is another measurement system with its own error, bias and statistical state. When the operator submits his product for inspection, he determines its compliance with tolerances through his unique measuring system, and the inspector carries out such verification through his measuring system. Manufacturing personnel can give many examples where this leads to disagreements, when the same control dimension, falling within the zones at the tolerance limits, can be determined by the operator as in tolerance, and by the inspector as out of tolerance.
The stability of measurement systems and their consistency must be assessed before monitoring any production processes.
Determination of the effective increment (increment) of the measuring system
“The effective step of recording measurement values (minimum increment, increment) is in the range of values from 0.2 to 2 probable errors (probable error) of the measurement system. The probable error of the measurement system, in turn, is defined as (0.675 * σ meas.system ) stable measuring system. Otherwise, when using a measurement step of less than 0.2 probable errors, we will record noise, and when recording with a step of more than two probable errors, we will lose information important for analysis, receiving inadequate units of measurement.”

Figure 10. The button for going to the panel for determining the effective increment of the measuring system is highlighted. Software "Shewhart control charts PRO-Analyst +AI (for Windows, Mac, Linux)".
In Figure (11) below, the [σ] sigma field of the stable measuring system is filled by default with the value [σ] from the measuring system offset function described above and can be entered by the user. The [[σ * 0.675] probable IS error] field is calculated automatically when you click the [Recalculate] button.

Figure 11. Panel for determining the effective increment of the measuring system. Software "Shewhart control charts PRO-Analyst +AI (for Windows, Mac, Linux)".
The user must select convenient values for the effective measurement increment in the field in this area, after which the graph will display the [purple] longest label for that value. The convenience of the effective increment value is determined by the simplicity of rounding the values of the controlled parameters measured using this measuring system.
Please note that the value entered for the user-selected effective increment must be within the range of values between the [red] marks of the upper and lower limits of the effective measurement increment and as close as possible to the [green] mark of the probable error (probable error) of the measurement system.
After the user enters the selected value of the effective increment of the measuring system and clicks on the [Recalculate] button, the selected value is displayed on the graph with a [lilac] mark, and the [IC Increment Scale] axis will automatically be scaled if necessary for better visualization.
![The user selected the value of the effective increment of the measuring system [0.5]. Shewhart control charts PRO-Analyst +AI](https://advanced-quality-tools.ru/images/articles/scc-python-measuring-system-increment-10.png)
Figure 12. The user selected the value of the effective increment of the measuring system [0.5]. Panel for determining the effective increment of the measuring system. Software "Shewhart control charts PRO-Analyst +AI (for Windows, Mac, Linux)".
![The user selected the value of the effective increment of the measuring system [1.0]. Shewhart control charts PRO-Analyst +AI](https://advanced-quality-tools.ru/images/articles/scc-python-measuring-system-increment-11.png)
Figure 13. The user selected the value of the effective increment of the measuring system [1,0]. Panel for determining the effective increment of the measuring system. Software "Shewhart control charts PRO-Analyst +AI (for Windows, Mac, Linux)".
The closer the measuring system increment selected by the analyst in the range specified by D. Wheeler to the value of the probable error (probable error), the higher its efficiency. A natural limitation in this process is the ease of recording measurement values. So, of the two figures 12 and 13, the best value of the increment of the measuring system is displayed in figure 12, equal to [0.5].
The effective increment selected (in accordance with the specified rule) must be used when determining the accuracy of recording values obtained using the analyzed measuring system, as its increment.
The result of choosing an effective increment can be saved by the user in graphic form (vector and raster) in high resolution, see below.

Figure 14. The button for going to the control panel for saving the current graph in a graphic format (raster or vector) has been added.

Figure 15. The control panel for saving the current chart in graphic format is open. See detailed description Functions for exporting graphs in vector and raster formats .
If your team is interested in improving the quality of their output, take care to review the records units of measurement for adequacy for improvement purposes using Shewhart control charts even before the start of testing of manufactured products.
Evaluating the Measurement Process (EMP). Parallelism, position, consistency.
The purpose of this special data grouping function is described in detail in the article by Donald Wheeler: Evaluating the Measurement Process (EMP).

Figure 16. The button to go to the Evaluating the Measurement Process (EMP) control panel is highlighted.
After constructing an XbarR control card for analysis of a measurement process (EMP), groups of interactive buttons (parallelism, position, consistency) are displayed in the area between the graphs if the number of operators on one control card does not exceed six. By clicking the left mouse button they change their state.
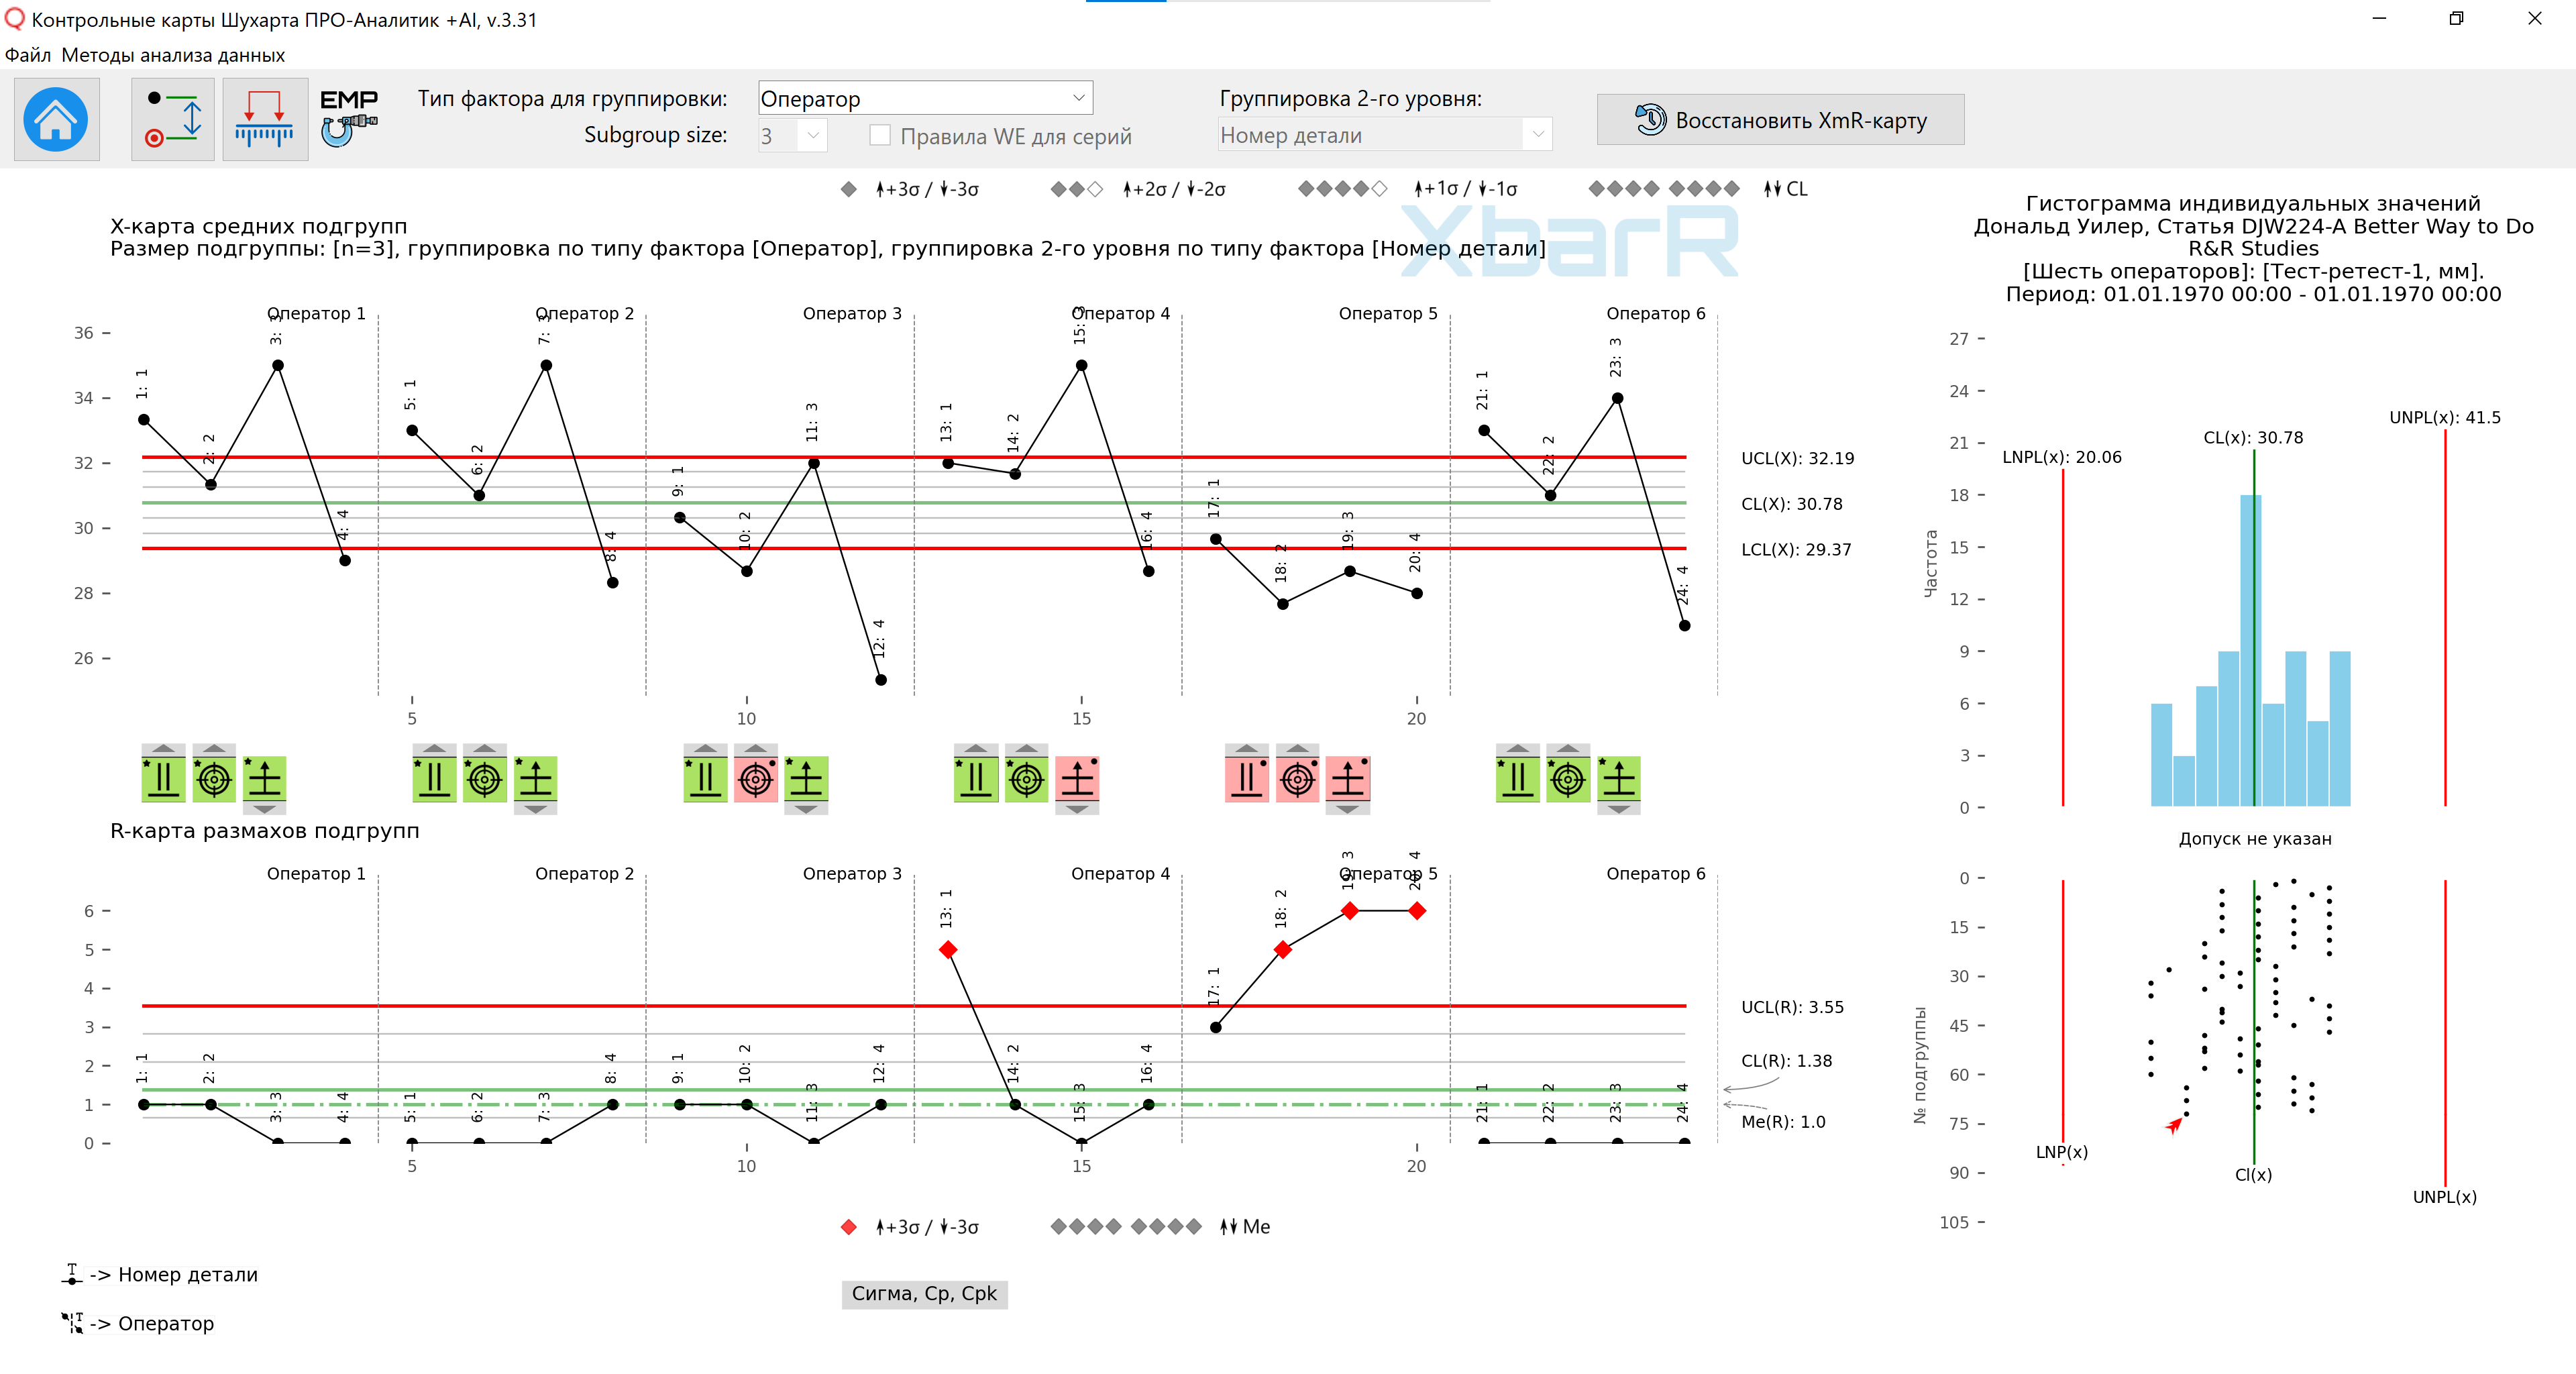
Figure 17. Grouping data into rational subgroups for Evaluating the Measurement Process (EMP) for six operators.

Figure 18. Grouping data into rational subgroups for Evaluating the Measurement Process (EMP) for four operators.