A critical look at the use of KPIs in the personnel motivation system. Or how management deprives itself of the most important information for managing the company and destroys teamwork. What instead?
Material prepared by: Scientific Director of the AQT Center Sergey P. Grigoryev .
Free access to articles does not in any way diminish the value of the materials contained in them.
In companies where people are evaluated and ranked numerically, where their salary, bonuses and promotion opportunities depend on meeting individual KPIs, people cannot believe that work can be fun, and their performance is at its lowest level, regardless of financial company indicators.

“KPI is a measure of inefficiency. When we focus on achieving specific metrics, we lose sight of the most important goal - customer satisfaction."

“KPIs can create the illusion of success, but in reality they can distract from a company's long-term strategic goals.”

“Focusing on KPIs may lead to short-term wins, but in the long run it can be detrimental to deeper growth and innovation.”

“Focusing on KPIs can cause us to play the numbers game instead of focusing on creating value for our customers.”
“Managing by numbers is an attempt to manage without knowing what to do, which in fact usually amounts to managing by fear.
Everyone presents or tries to present themselves in a favorable light for their own survival. The organization as a whole is losing."
Preamble
I often hear about company management undergoing training in team building, project management, goal setting, etc. What kind of team work can we talk about in their companies if the same management sets individual goals for team members in the form of KPIs or their analogues, from achieving which determines the position of the “team” members in the company?! At the same time, what is striking is the demonstrative thirst of modern management to “study” any newfangled method on how to make people work in their companies.
In my conversation with an employee of a company included in the top twenty of the RBC 500 Rating, he explained the meaning of the individual KPIs assigned to him, with his own understanding that everything he had done before in the company was difficult to measure numerically and therefore turned out to be unnecessary. Now only numerically measurable performance indicators determine how this employee will be evaluated in the company and he will have to focus his activities only on them. In response to my arguments against this approach to management, this employee said: “But everyone can’t be wrong?!”
All I had to do was assure him that even before the statement of Nicolaus Copernicus in 1543, everyone believed that the sun revolved around the Earth, and not vice versa. Long after Copernicus’s statement, many did not accept the new knowledge; it took decades. This employee probably wanted to object, for example: “But that’s a different matter,” but he remained silent in response.
The very popular and equally false paradigm that you cannot manage what cannot be measured mercilessly simplifies the role of modern management.
“The most important factors needed to manage any organization are usually unknown and cannot be quantified.”
The financial well-being of this company from the top twenty of the RBC 500 Rating, which apparently finds itself in this position by chance , has completely blinded its management, which manages as best it can, ineptly wasting resources that could have been aimed at actual transformations.
“Annual performance reviews have permeated and become popular in organizations because they don’t require anyone to solve people problems. It’s much easier to rank those people by focusing on outputs.
The idea of certification is seductive. The sound of the words stimulates the imagination: pay for what you get; get what you paid for; motivate people to give their best for their own benefit.
The effect is completely opposite to what is promised in words. Everyone presents or tries to present themselves in a favorable light for their own survival. The organization as a whole is losing.
Moreover, performance appraisals are meaningless from the point of view of predicting the future performance of the appraisee, unless the effect of individual differences exceeds the differences caused by the system in which people work.
Traditional performance appraisal systems increase variability in people's performance. The problem lies in the assumed accuracy of grading methods. What does this lead to? Those whose results were below average look at those who were above average and wonder: what is the difference? This forces people to work with averages. As a result, the results worsen.
Management in this case simply shifts its responsibility to people who cannot influence quality, productivity or offer innovation."
Are the management methods that everyone believes in really effective?
Most managers will obviously deny that they manage based on the assumption that people's natural abilities are about the same. But much of what they do can only be understood from this premise. The system of rewards for personal contribution, incentive schemes, bonus systems, of course, are aimed at encouraging and rewarding efforts. But what is the point of ranking people according to natural abilities if real benefits can be achieved when these differences can be recognized and combined?

Rice. Caricature. Same KPIs for employees. Author unknown.
An article about a report from the start of Lada Vesta production contained photographs demonstrating how work with personnel was structured in the AVTOVAZ stamping shop, see Fig. 1 and Fig. 2.
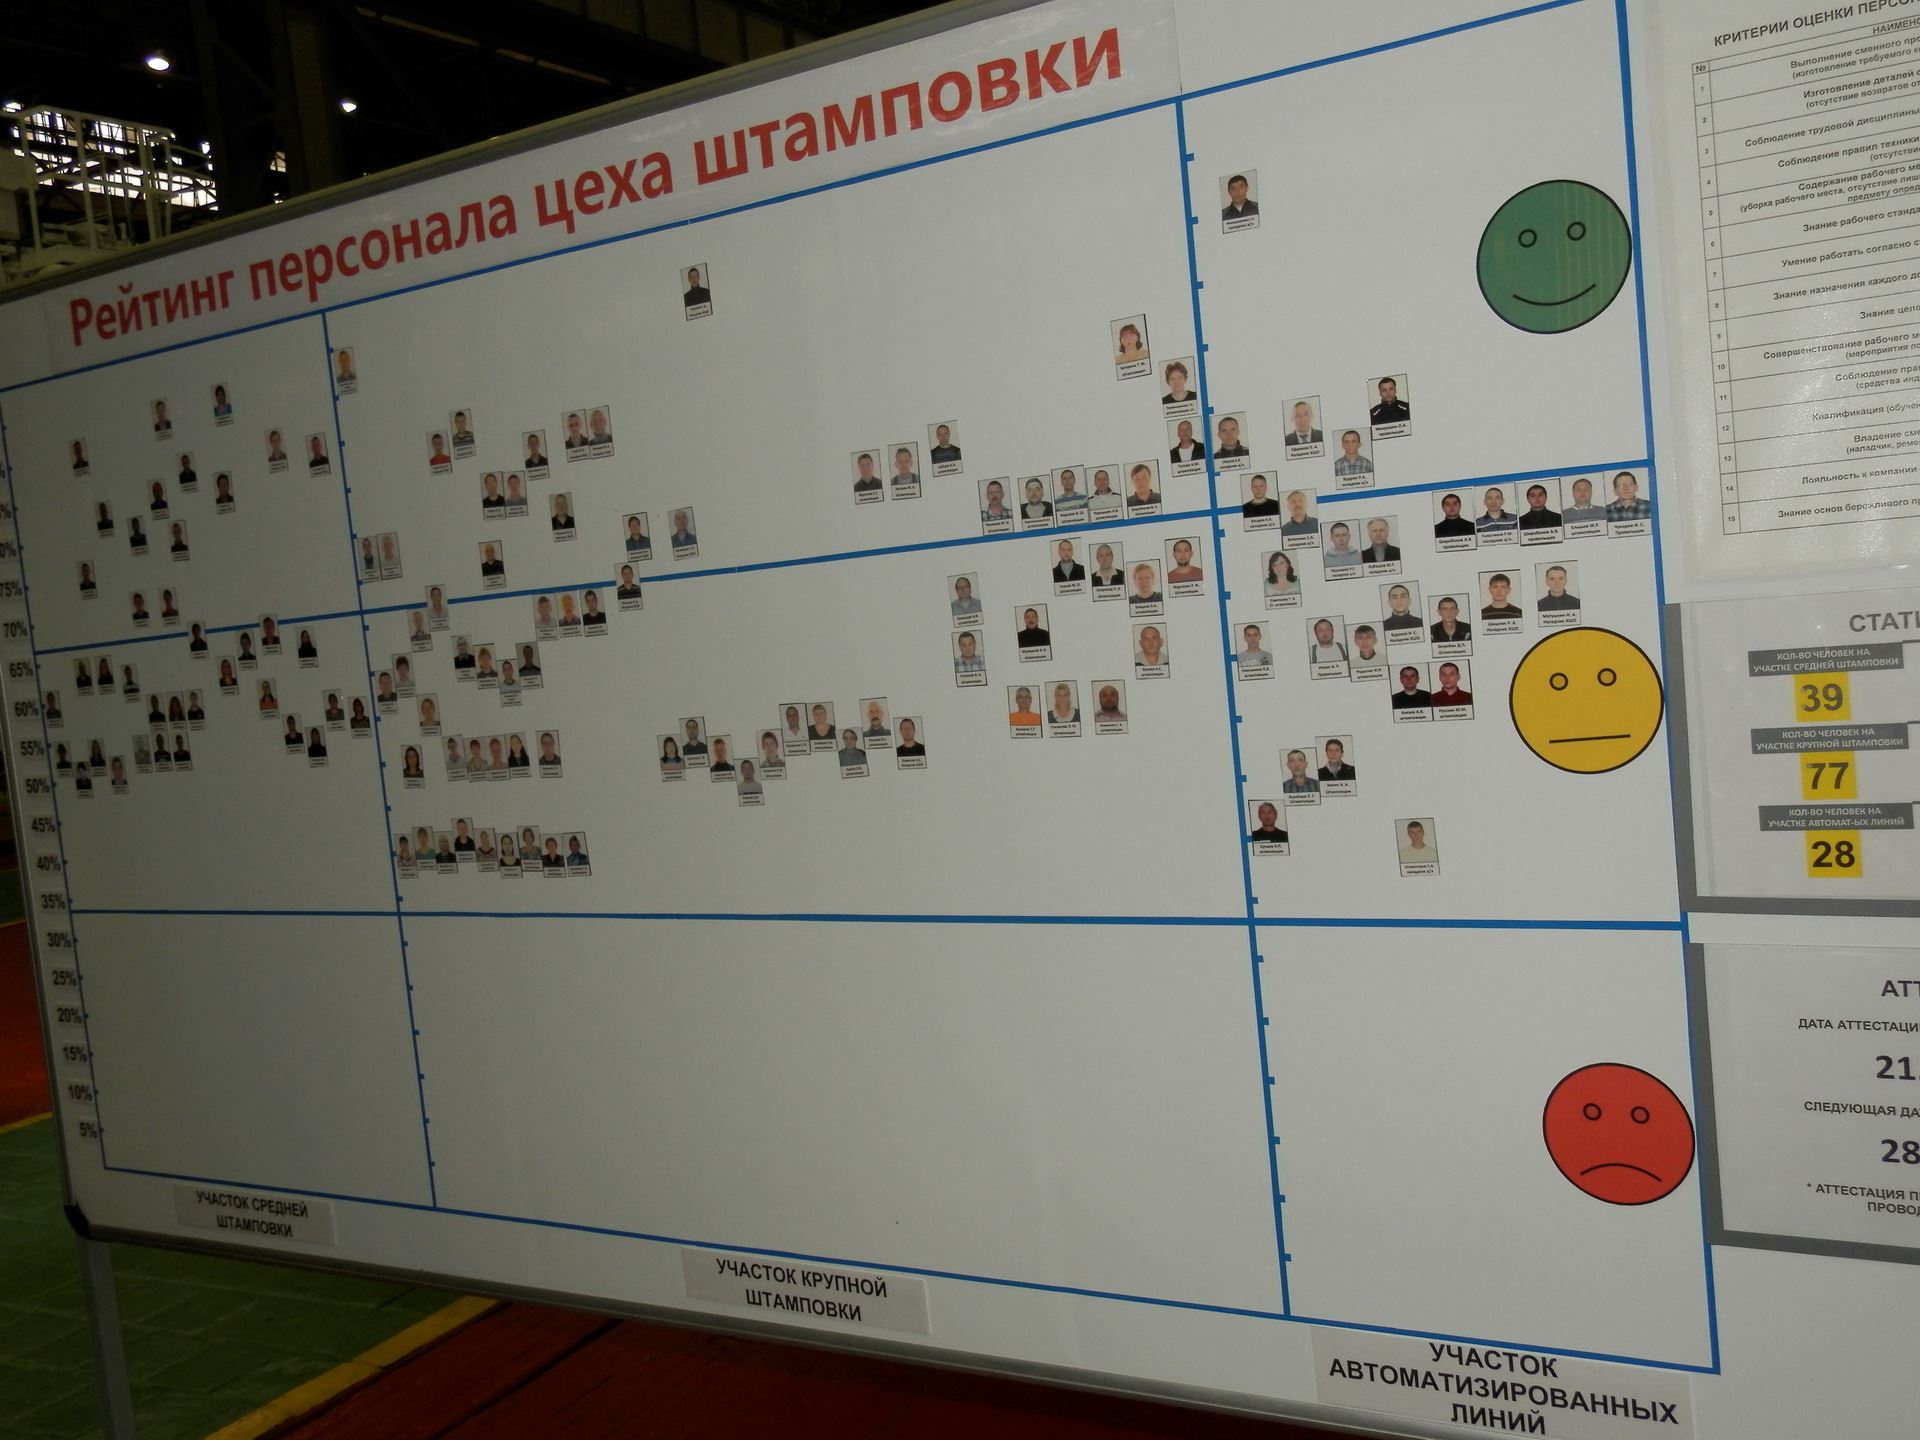
Figure 1. Photo of the board with the rating of the staff of the Stamping shop. Source: Report from the start of Lada Vesta production .
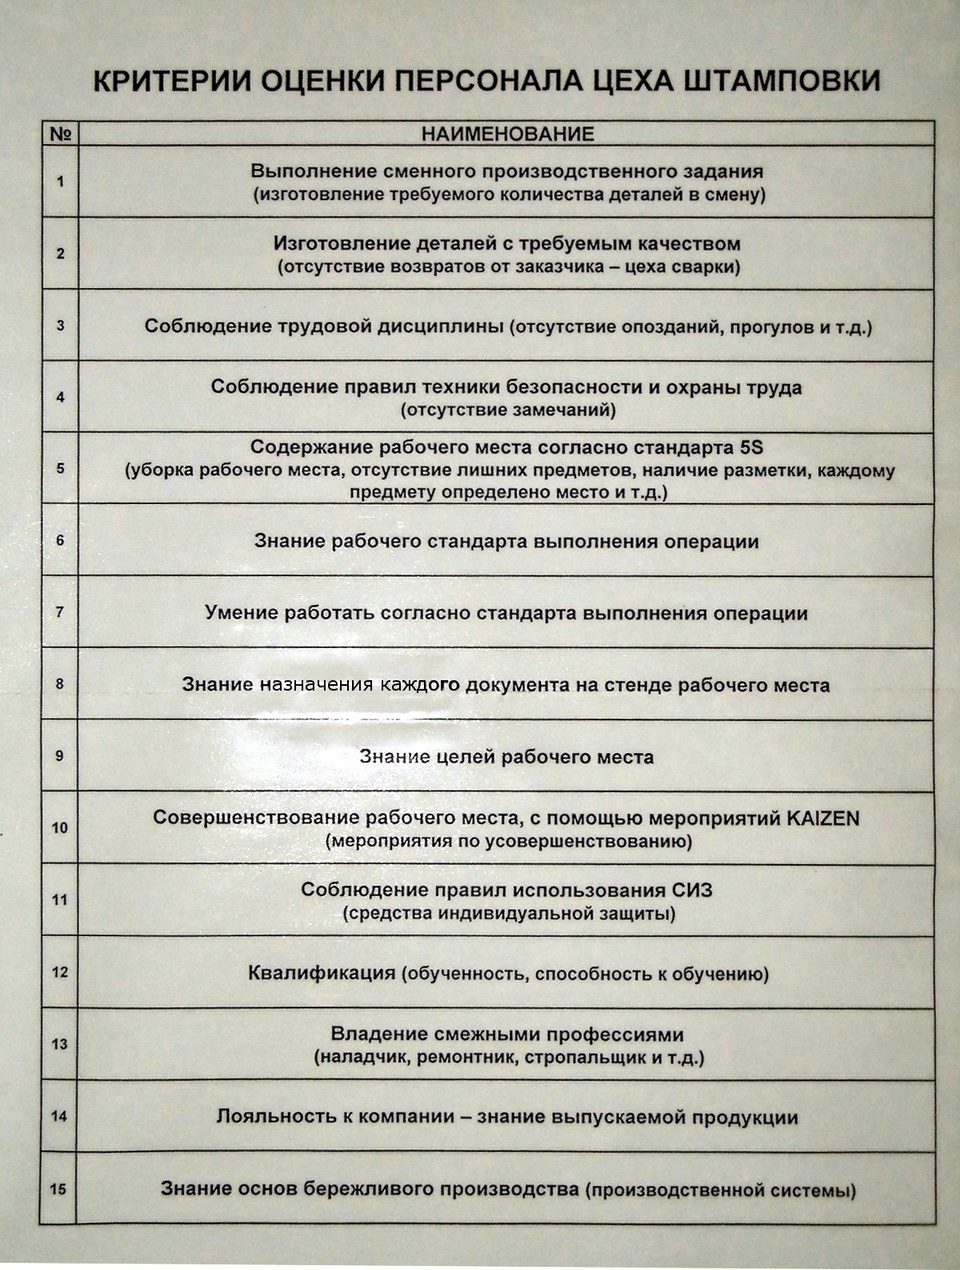
Figure 2. Photocopy of the stamping shop personnel evaluation criteria used for the rating shown in Figure. 1. Source: Report from the start of Lada Vesta production .
A comment
Who assigns a person a position in this personnel ranking? How does he manage to convert the employee's rating on each criterion in Figure 2 to the total number on the y-axis in Figure 1?
And if you simply did not see the “problems” of one employee and, by chance, stumbled upon the “problems” of another, how will you reflect this in the ratings of both?
What's next for this? Why is someone doing this work?
Most likely, the management of this enterprise has nothing to do; the workers, “good”, “average” and “bad” are responsible for everything. True, no one was included in the “bad” rating; all the “bad” ones were most likely left close to the border from “average” to “bad” on the “average” side. Look at Figure 1 (second column), there are 9 people in one row.
Try to give yourself a score in the form of one specific (aggregated) number on the Y-axis of Figure 1, taking into account each of the given criteria in Figure 2. This is simply impossible! How to operationally accurately or at least approximately determine the number that fairly corresponds to a person even according to one criterion, but what can be said about all the criteria?
A board with ranking “photos” of employees is a demonstration of the enterprise management’s lack of understanding of how to manage people in production. This is an attempt by management to transfer responsibility for the work of people in the workshop to the workshop management (foremen, site managers, etc.), who themselves will not be able to change anything. People in the shop work in a system created by top management, are trained according to programs adopted by top management, use equipment, standards, rules and methods provided by top management, the equipment is maintained by the plant repair service managed by the same top management. There is no limit to the list of things that the top management of an enterprise needs to do instead of ratings.
"The management doesn't know what their job is.
Something more is needed to achieve success: only theory can help us imagine what is true and what is false.
Many people know about statistical quality control in production. This is important, but production is only a small part of the overall system. You can achieve 100% success within production and, in the end, go bankrupt. The most important application of the principles of statistical quality control, by which I mean knowledge of common and special causes of variation, is in human resource management."
The best solution is to use statistical thinking in managing the work of people in a company.
In one study, I had to demonstrate to a manager how the business system he had built interacted with seven employees in the sales department. For this purpose, one of the evaluation parameters used in the company was selected - sales revenue.
It will be useful to remember the fourth part here Edwards Deming's Deep Knowledge Systems , namely understanding and accepting the natural differences of people.
Natural differences are not the superiority of some over others, but are the basis that a specific, far from perfect business system (conditions, rules, methods) uses to rank people. In any other business system, the assessed parameters of the people in question are likely to be significantly different. By firing employees “not accepted” by your system, hiring new ones, even with excellent past experience they declare, no one can predict how your system will accept them.
I used weekly revenue data for the last 20 weeks of the reporting year.
For the first part of the analytical study, I chose the XbarR-chart of averages and ranges of subgroups, because I wanted to understand which employees work outside the system with the best or worst results, and who works within the system.
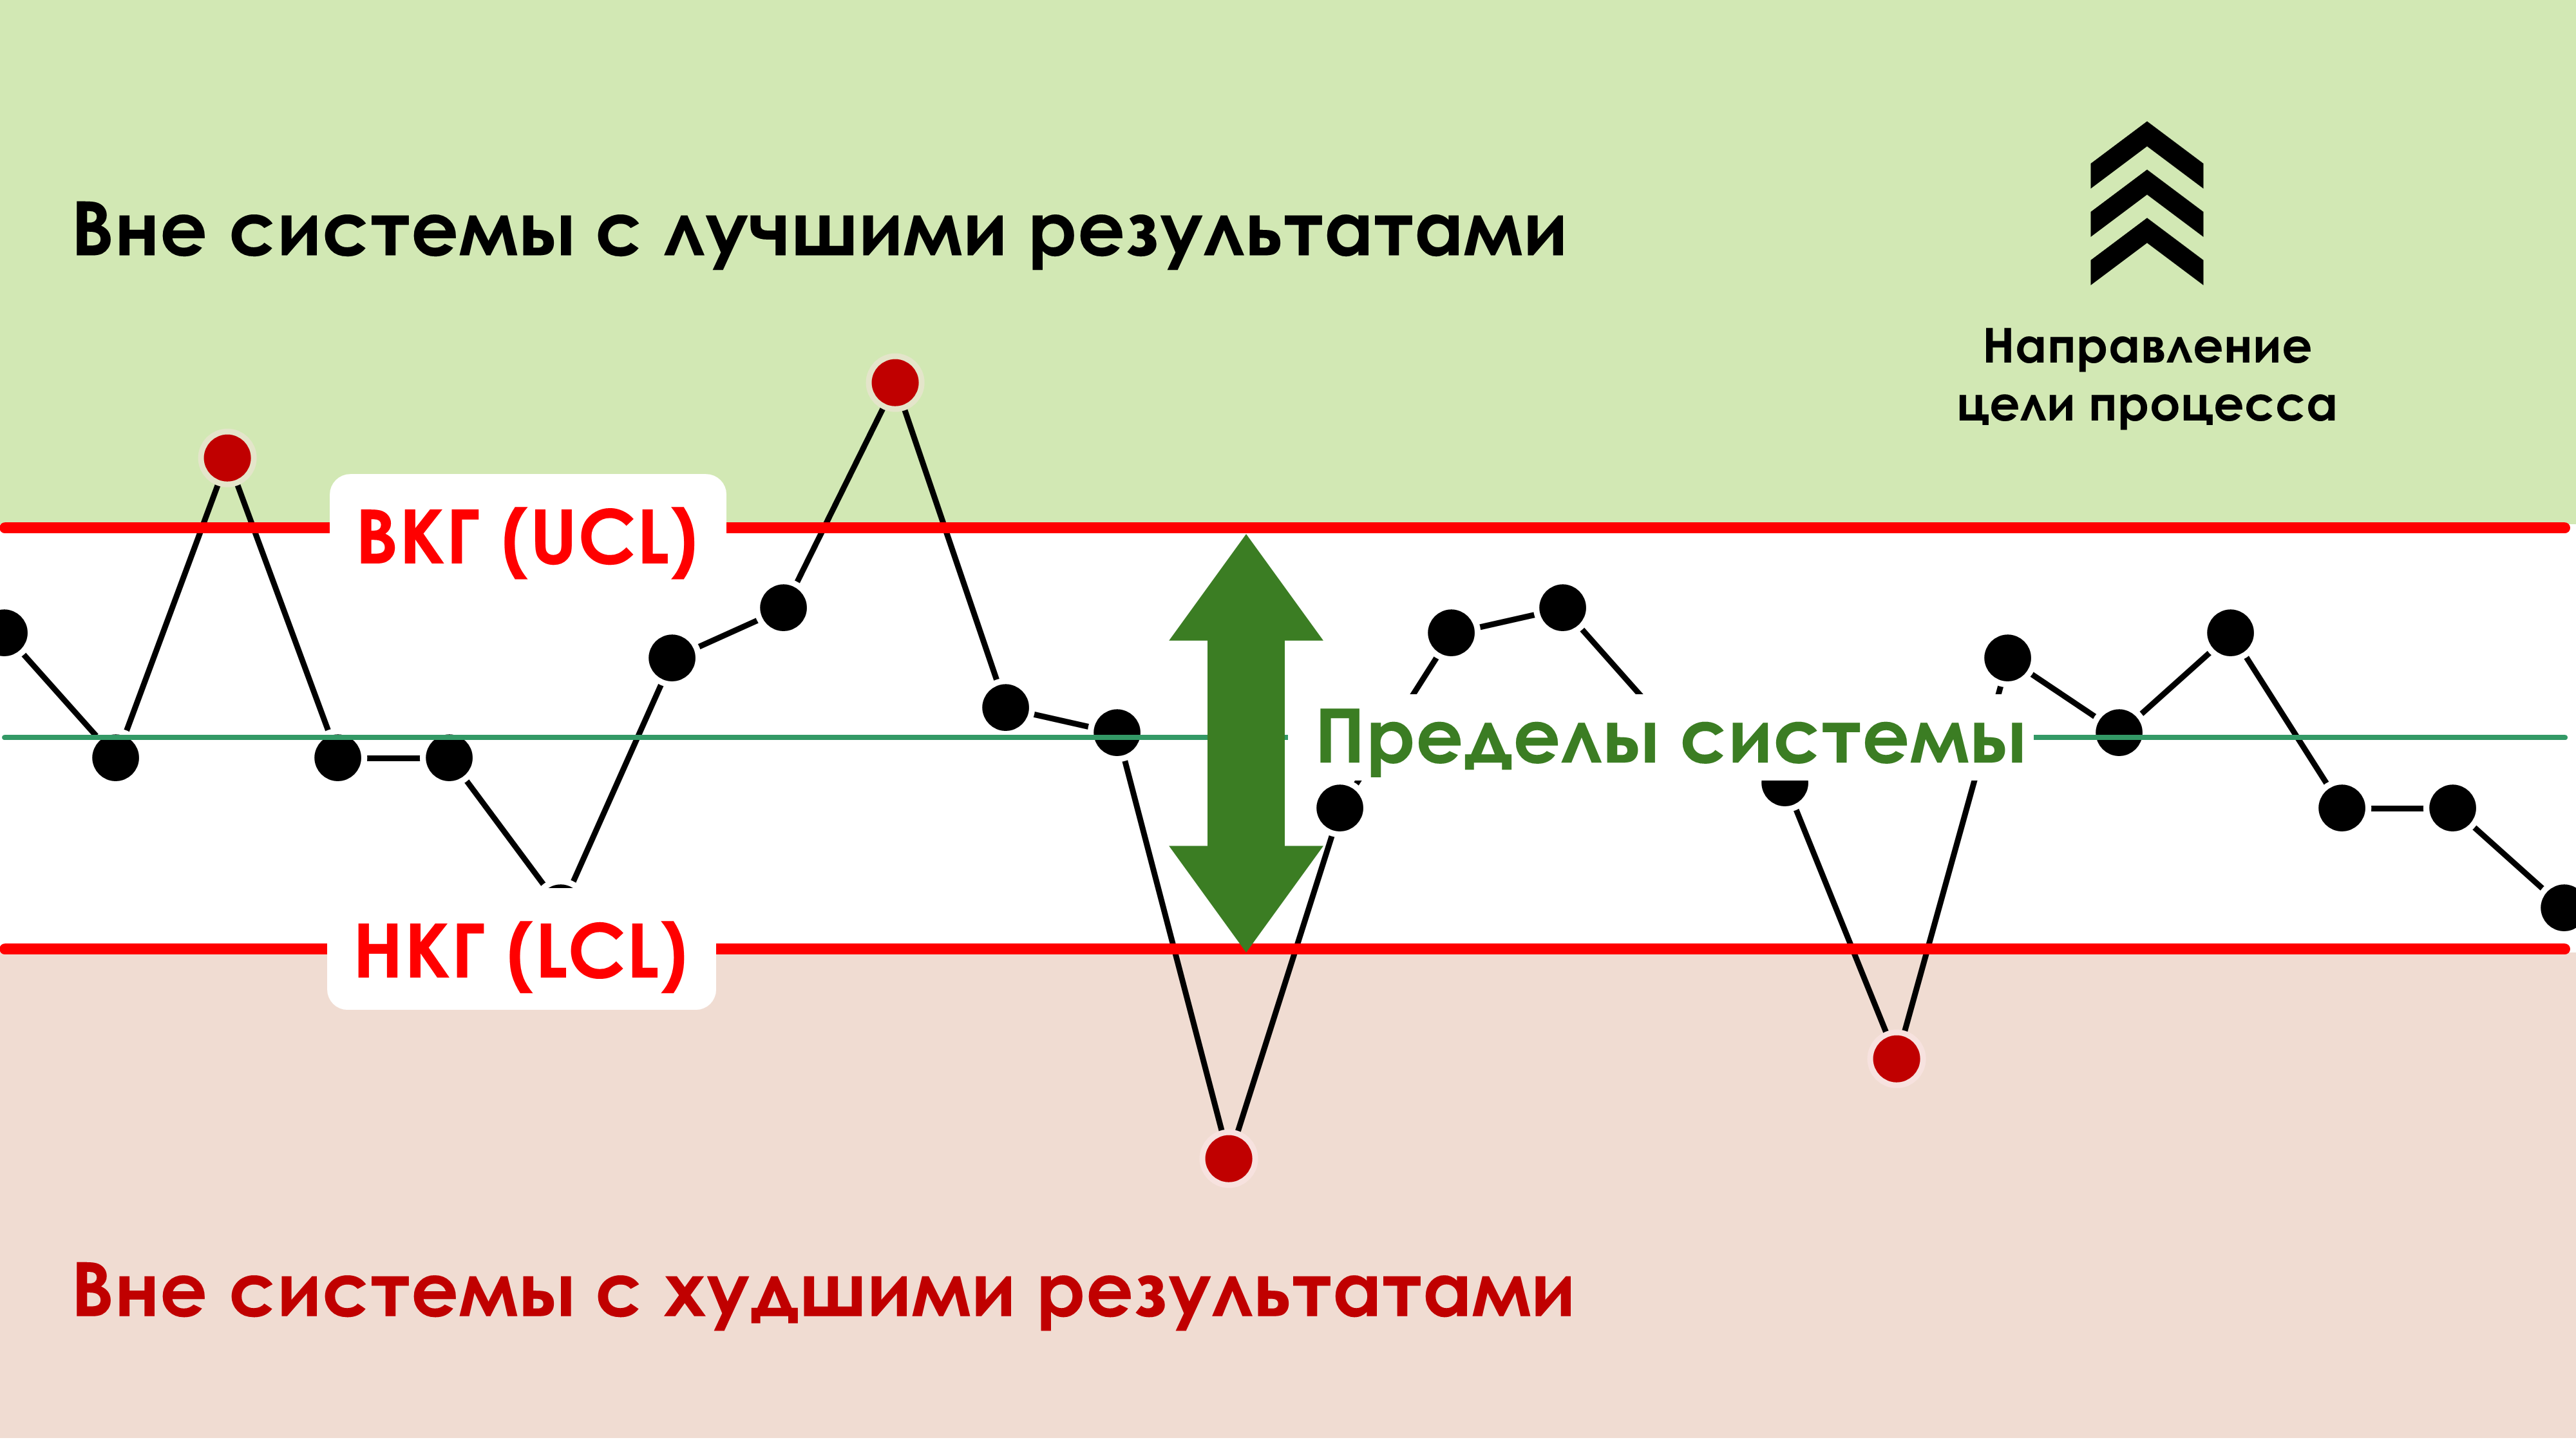
Figure 3. System limits in terms of Shewhart control charts.
I grouped the data for 4 consecutive weeks in one subgroup for each salesperson (there were 5 subgroups for each employee) and built a Shewhart XbarR control chart. See Figure 4.
What is the variability observed in a control chart trying to tell us about the system and the people who work in it?
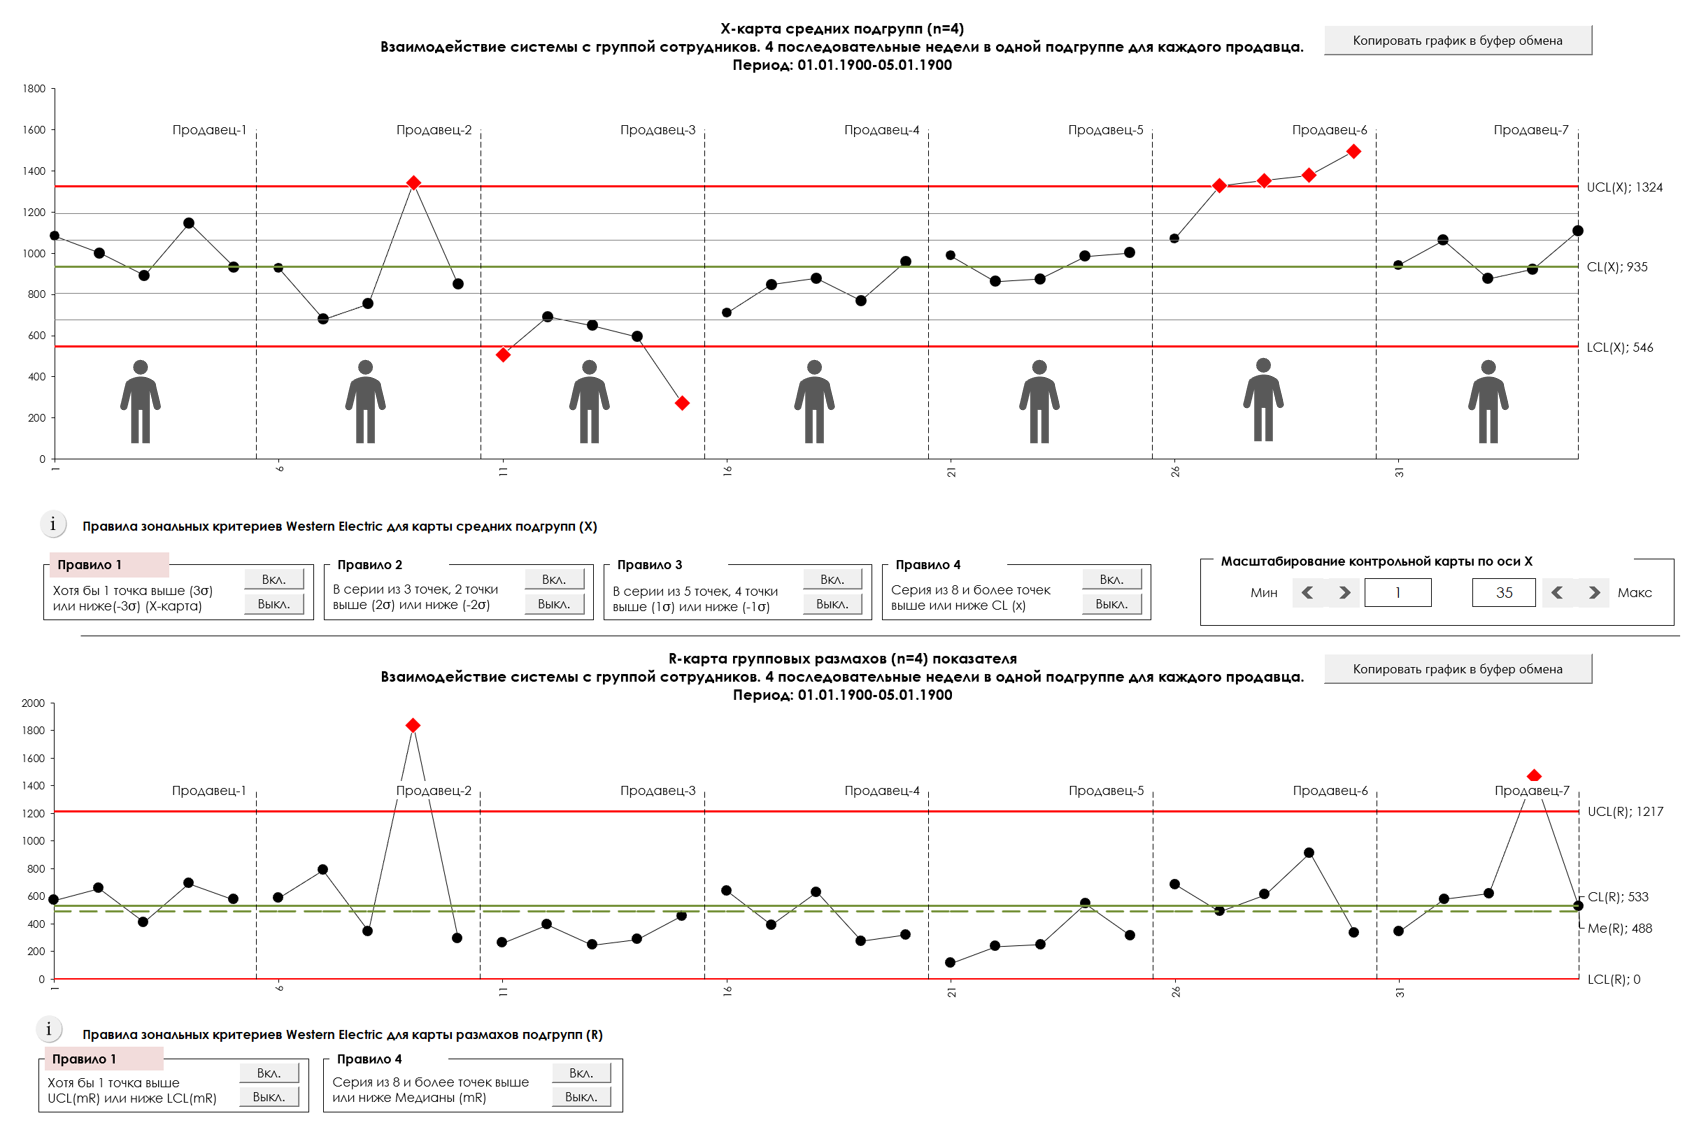
Figure 4. Interaction of the system with a group of employees. Control chart of averages and ranges of subgroups XbarR-chart. UCL - upper control limit, LCL - lower control limit, CL - center line. The drawing was prepared using the software we developed “Shewhart control charts PRO-Analyst +AI (for Windows, Mac, Linux)” .
Only Rule 1 of Western Electric's zonal criteria applies to the control chart. The system exhibits a statistically uncontrollable (unpredictable) state, as demonstrated by the red dots above and below the control limits. There is no point in predicting the potential capabilities of such a system.
First of all, management will need to bring the system into a state of statistical controllability, eliminating the special causes of variability, the effect of which manifested itself in the red dots.
On the chart of average subgroups:
- Seller-3 went worse beyond the lower control limit (LCL) in subgroups 11 and 15 - outside the system with the worst results.
- Sellers 2 (subgroup 9) and 6 (subgroups 27-30) were better than the upper control limit (UCL) - outside the system with the best results.
- On the R-map of group ranges, sellers 2 (subgroup 9) and 7 (subgroup 34) also showed special reasons for points going beyond the upper limit.
We must understand the specific reasons that caused the series of red dots.
In Fig. 4, only sellers 1, 4 and 5 work within the system. Until the system is brought to a statistically stable (predictable) state, they can be left alone. You should not make systemic changes before bringing the system to a statistically stable state, since you will not be able to reliably assess the effectiveness of the undertaken systemic changes in this situation. That is, after attempting changes, the data may show some improvement or deterioration, but in an unstable system, these jumps may be due to special reasons, and not your actions.
Figure 4 (repeat for convenience). Interaction of the system with a group of employees. Control chart of averages and ranges of subgroups XbarR-chart. The drawing was prepared using the software we developed “Shewhart control charts PRO-Analyst +AI (for Windows, Mac, Linux)” .
Seller-2 requires special attention due to the fact that the average (X-card) and range (R-card) in the 9th subgroup exceed the upper control limit (see Fig. 4.). In any case, look for special reasons that appear in the red dots. Next, we will return to Seller-2 when assessing the stability of his personal indicators.
Seller-3 requires special attention to himself, because on the X-map, points 11 and 15 subgroups revealed the presence of a special reason that determines his results. Its efficiency is lower than the capabilities of the system according to the average of the “red” subgroups; it is outside the system with the worst results. Perhaps during this period he was in more difficult conditions than other sellers and he needed help from management, and if not, perhaps he was not doing his job (further, in Fig. 5. we will assess whether he has achieved stability so that understand whether repeated training will help him). Management needs to be attentive to such employees and understand the reasons for their situation. Edwards Deming cites many examples where, in jobs requiring good vision, the use of glasses brought people back into the system.
Figure 4 (repeat for convenience). Interaction of the system with a group of employees. Control chart of averages and ranges of subgroups XbarR-chart. The drawing was prepared using the software we developed “Shewhart control charts PRO-Analyst +AI (for Windows, Mac, Linux)” .
Seller-6 requires studying his work, because he exceeds the capabilities of the system according to the results of the average 4 subgroups on the X-map of the average subgroups, he is outside the system with the best results. Perhaps he was in a privileged position during this period, for example, his sales are due to the formation of high customer expectations of the company's products and commitments, or his region of work provides a clear advantage, or his orders have priority when launching production compared to the orders of other employees etc. You will need to figure this out.
In my practice, there are often cases when “stars” become not due to superiority over the system, but due to working with large clients themselves. Some people inherited them from retired employees, while others were given such clients by their manager. These cases fit well into special working conditions with a clear privileged position. This will require the attention and objectivity of the manager so as not to violate the principle of fair remuneration.
If the control chart identifies employees working outside the system with the best results, it is necessary to ensure that they work on equal terms with others.
If we were talking not about sales, but about production, for example, the process of machining parts, and the indicator would be the implementation of the plan per piece, as in the open solution: Quality or quantity? The first thing we needed to pay attention to was compliance with the technology for processing parts by machine operators. For an easy visual comparison of the “performance” of individual operators with a process proceeding in compliance with the technology, control limits similar to Figure 4 of a general Shewhart XbarR-card built for all operators and a certain virtual operator (a process proceeding under the close control of technologists and quality service on an equal basis with others) could serve operators conditions). In the situation described in the article linked above, such a “virtual operator” could well end up outside the system with worse results. The management of this enterprise would have something to think about.
If this is not the case, perhaps Salesman-6's methods should be studied and adopted by other sellers, and Salesman-6 himself may have unique abilities and deserve special reward and recognition. If you pay salespeople a percentage of sales, it's unlikely that anyone will share their methods with other team members. In any case, look for special reasons for his situation.
Figure 4 (repeat for convenience). Interaction of the system with a group of employees. Control chart of averages and ranges of subgroups XbarR-chart. The drawing was prepared using the software we developed “Shewhart control charts PRO-Analyst +AI (for Windows, Mac, Linux)” .
Seller-7 requires special attention to himself, because for the 34th subgroup on the R-map of group ranges he turned out to be above the upper control limit (outside the system) and thus demonstrates signs of the presence of a special cause during the formation of this subgroup. In any case, look for special reasons.
I would like to pay special attention to what to do when special reasons are found.
1. If the special causes found led to a deterioration in work results, try to completely eliminate them; if you cannot eliminate them completely, make efforts to minimize their impact on the work of your employees.
2. If the special causes found to lead to improved performance, and they are not related to the employee's privileged position or unique abilities, try to turn such special causes into ongoing systemic common causes (for example, work practices) for other employees. Be careful when examining outstanding results for possible negative impact on the company's overall results, both in the short and long term.
At the next stage, I built a control XbarR-chart of the averages and ranges of subgroups from 4 consecutive weeks, separately for all sellers, see Fig. 5. What is the control chart trying to tell us about the system and the people in this case?
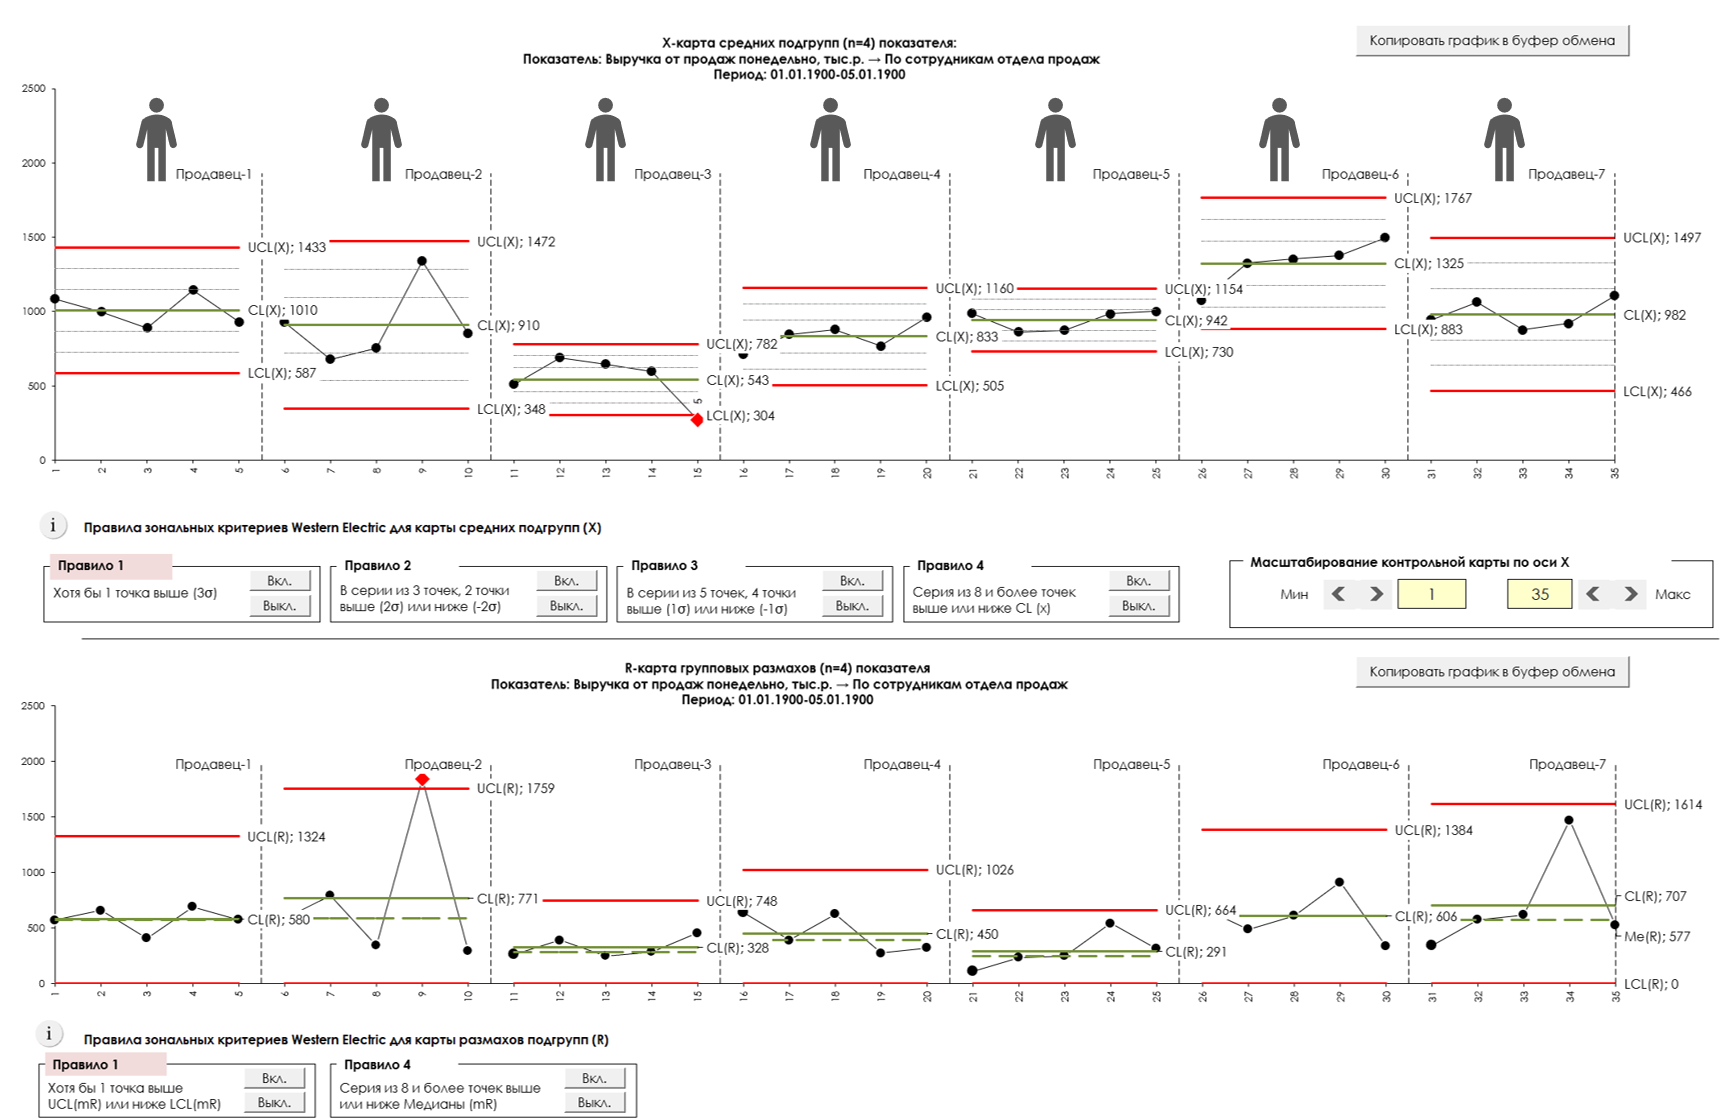
Figure 5. Interaction of the system with individual employees. Control chart of averages and ranges of subgroups XbarR-chart. The drawing was prepared using the software we developed “Shewhart control charts PRO-Analyst +AI (for Windows, Mac, Linux)” .
Sellers' data (Fig. 5) 1, 4, 5, 6, 7 demonstrate the achievement of an individual state of statistical controllability. Interfering with their work is highly undesirable. You can leave them alone and continue to maintain XbarR control cards of averages and ranges of subgroups separately for each employee. Further training of these employees using the same methods will not change the results of their work and will not be cost effective. Retraining is always more difficult, because having reached a state of statistical stability, employees are already developing habits and work skills that will be difficult to change. But their individual state of statistical controllability may change with systemic changes implemented by management.
Sellers 2 and 3 are in an individual state of statistical uncontrollability. They require special management attention. Perhaps the training they received was insufficient. Repeated training using the same methods will still be economically feasible for them. And although Seller-3 currently demonstrates the worst results in terms of average sales revenue, after bringing this indicator to a state of individual statistical controllability, the position of Seller-3 in the company may change. Give him a chance.
For sellers whose results demonstrate individual statistical controllability according to the XbarR-chart, their results in the current system can be predicted using a rule of thumb, see Figure 6. As long as sellers are in a statistically stable state, this is the best basis for sales planning.
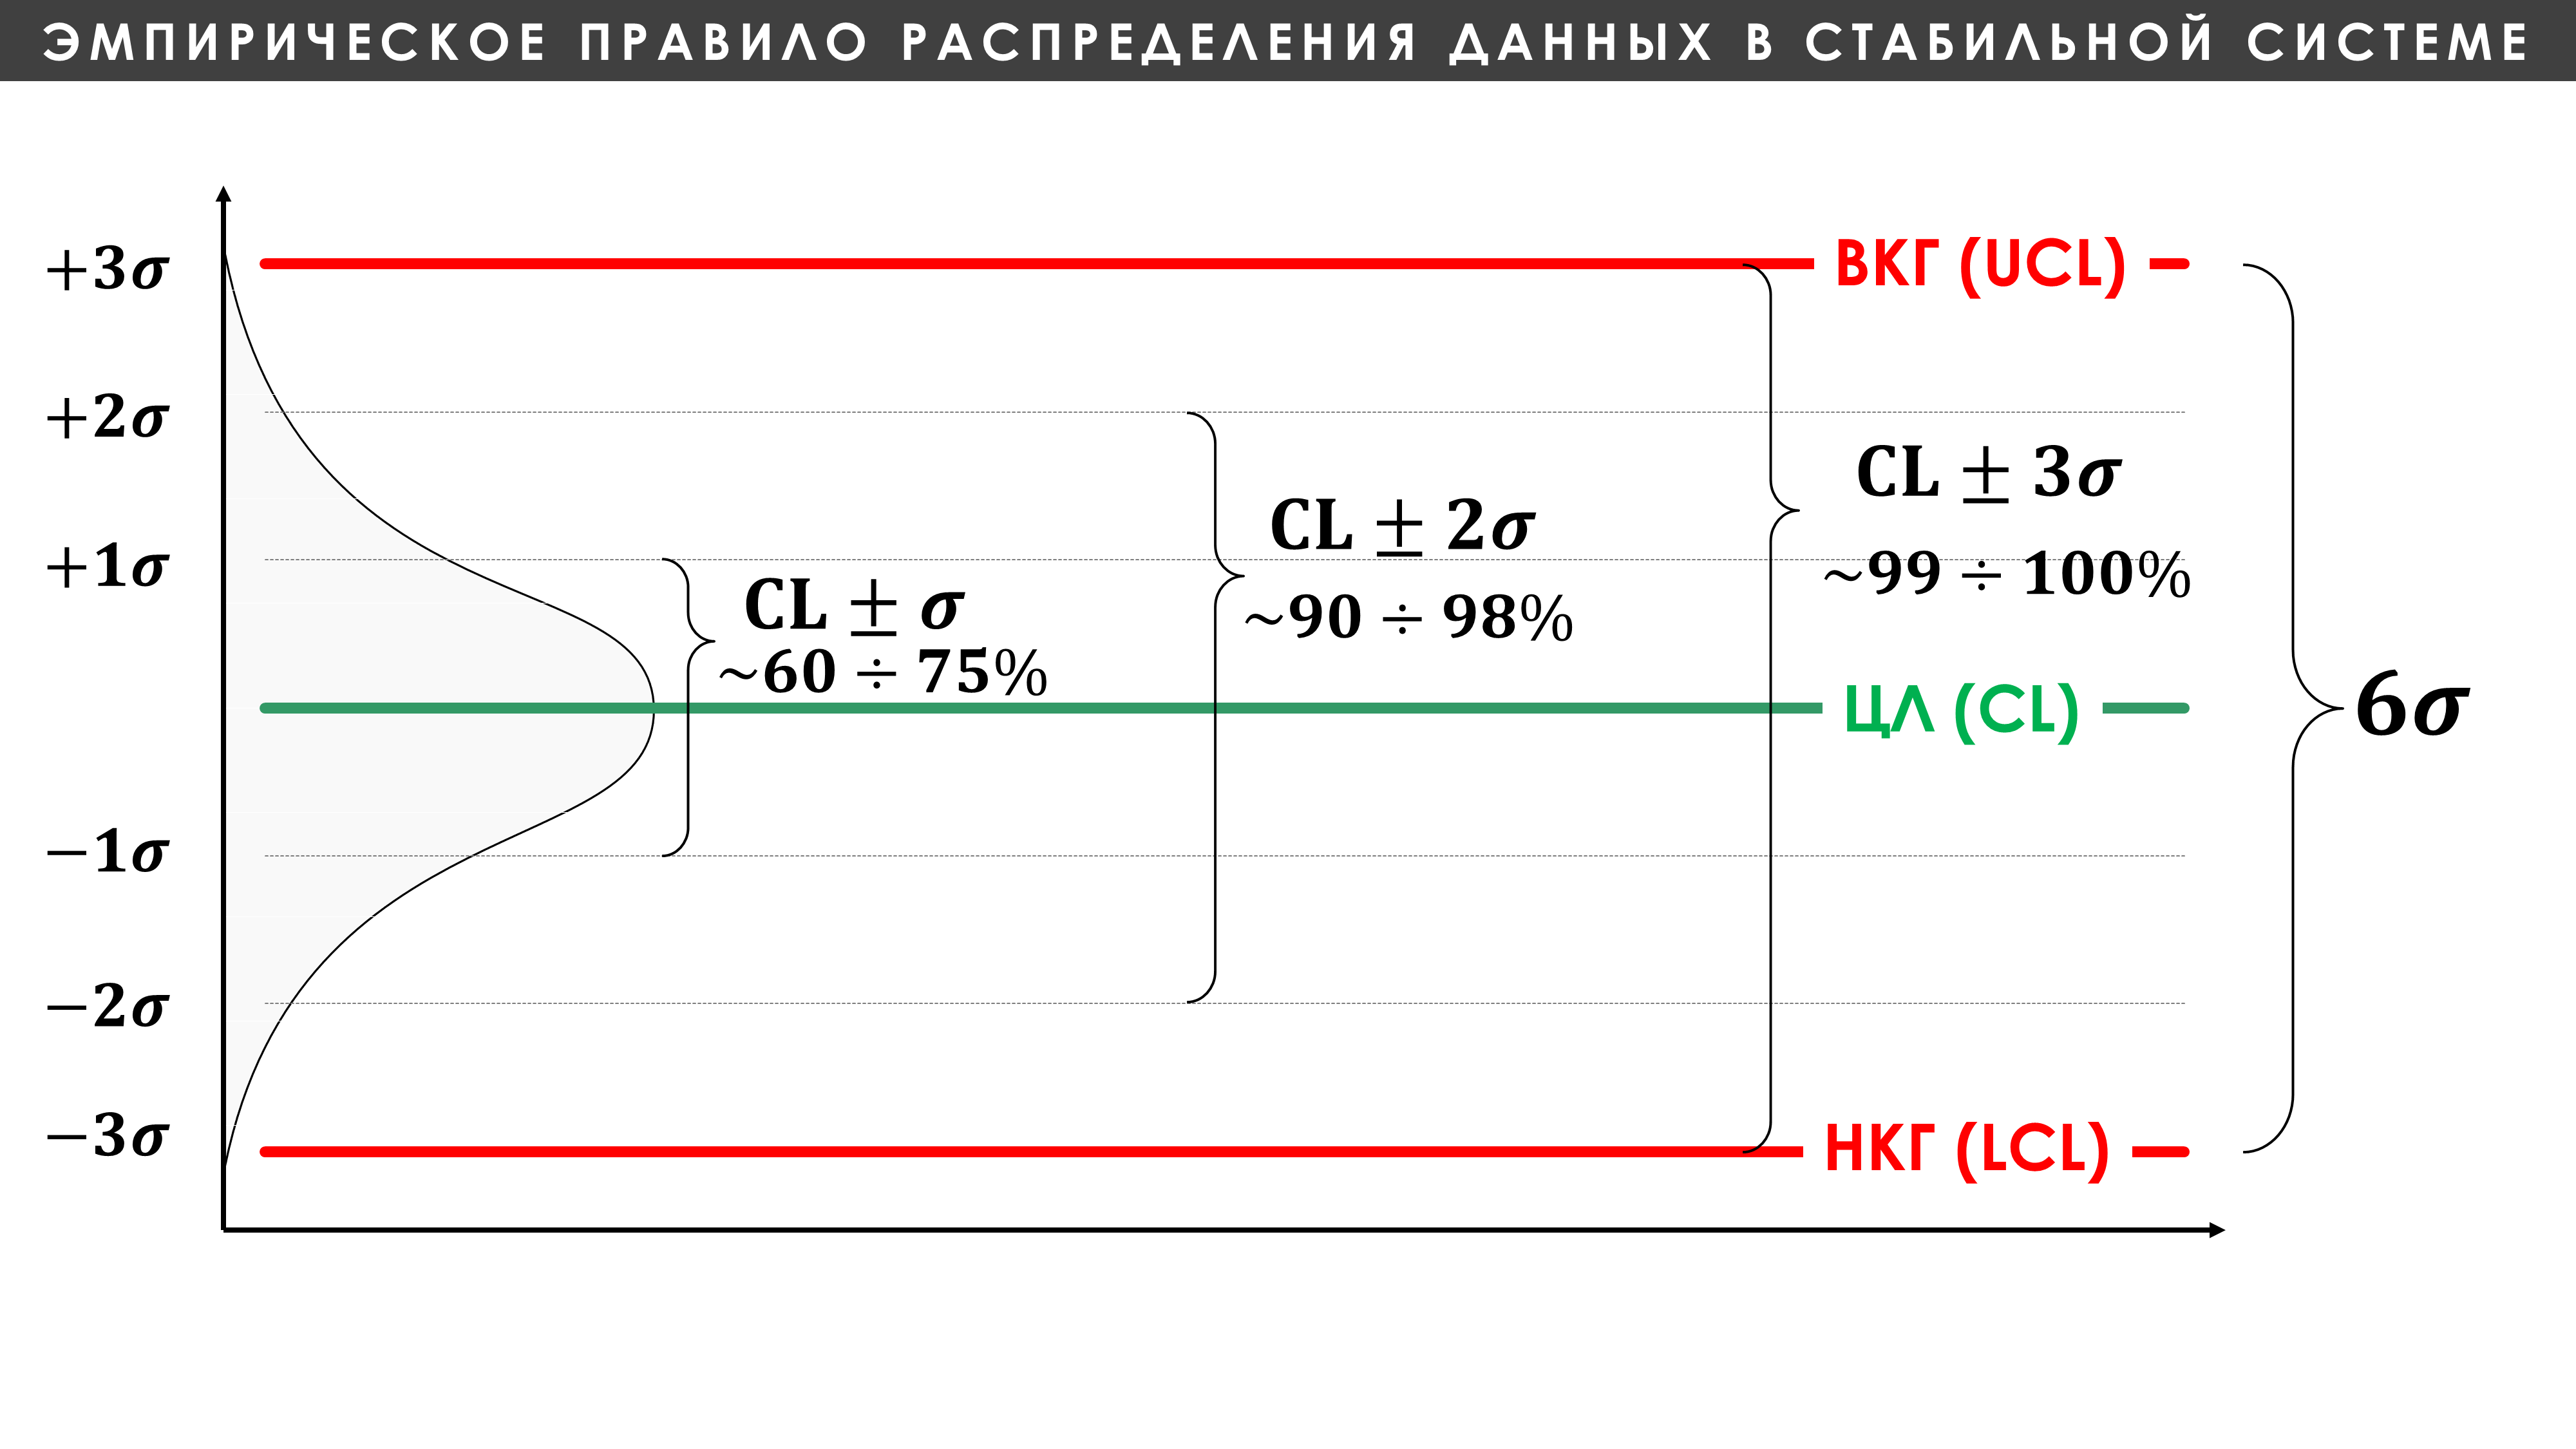
Figure 6. Rule of thumb for data distribution in a stable system. CL - central (middle) line, ВКГ - upper control limit, LCG - lower control limit, σ - measure of data scatter, a calculated value inherent in a specific unique process. See the article for more details: The nature of variability.
Moreover, it is a stable state that allows you to track the effectiveness of measures aimed at increasing sales and identify signs of the presence of special reasons leading to a decrease or increase in sales.
"Labor productivity can only be measured over the long term."
Below is a film about a method for quickly diagnosing actual changes in a process (system), both positive and negative, using the Shewhart control chart.
Video 1. A method for quickly diagnosing changes in a process using Shewhart control charts.
conclusions
Despite the wealth of new and useful information for improvement that comes from the scientific approach and statistical thinking, the vast majority of managers prefer to simply rank the people on the team as the best and the worst, placing all responsibility for individual performance on the performers themselves, who work in the environment designed by this management. , an imperfect system and they themselves cannot change it. Arranging numbers in descending or ascending order is a simple task for children in the preparatory group of kindergarten.
"At PQ Systems, we use Shewhart control charts in our sales, support, accounting and other systems. By tracking the number of outgoing and incoming calls, the length of time on calls, the number of contacts in each period, and other inputs, we can track trends and set realistic expectations for individuals and the department as a whole.
You will not find a single accountant in our company presenting the net profit this month compared to last month. Instead, net income is shown on a control chart for this month compared to the previous 24 or 36 months.
One of the biggest benefits of control charts is that subjectivity is minimized and decisions are made based on the data collected. The voice of the process tells you what is happening. When changes are made to a system for improvement, the Shewhart Control Chart will show you how the process behaves after the change so you can determine the impact.”
What should management do to improve sales efficiency when the system is brought to a state of reasonable degree of statistical controllability, see the open solution: Analysis of the number of outgoing calls from the sales department and arbitrary standards imposed by the manager on sellers .