Constructing Shewhart control charts using inadequate units of measurement leads to erroneous conclusions
It is a common practice when the owner invests in new measuring equipment with high measurement accuracy, perhaps unnecessary, throwing money down the drain, and the data collected using this equipment and recorded in the CIS turn out to be useless for their analysis in order to improve processes.
The material was prepared by the scientific director of the AQT Center Sergey P. Grigoryev .
Free access to articles does not in any way diminish the value of the materials contained in them.
In one of our projects, laboratory assistants from the quality control department tested finished products in accordance with the requirements of the relevant GOSTs; all records were kept in the corporate information system (CIS) by manually transferring the obtained measurements from the display of high-precision expensive measuring equipment. And everything would be fine, but no one in the company analyzed the test results.
This attitude towards the work of laboratory technicians gave them a natural need to minimize their labor costs by recording rounded measurement results by just one decimal place towards less accuracy, i.e. instead of 1.17 they wrote 1.2; instead of 0.97, 1.0 was written. The measurements obtained in this way most often fell within the tolerance limits, so the laboratory technicians had no reason to worry. By the way, the GOST standards used and the methodology for testing products did not stipulate this point in any way.
Built based on the data entered into the CIS by laboratory assistants, the Shewhart control chart of individual values and moving ranges (XmR map) demonstrated a statistically uncontrollable state of the process, which led to some confusion for the quality control inspectors and quality director.
The control chart showed a clear gradation in the recorded measurements. This is the first sign of problems associated with the use of overly rounded (inadequate) measurement values in calculations. The obtained values of process control limits, constructed using inadequate units of measurement, themselves become inadequate. Naturally, such control charts are unsuitable for assessing the statistical state of the process being assessed, much less for developing measures to improve it.
Unfortunately, it was not possible to restore historical values with greater accuracy, even by one digit (this might have been sufficient). No one recorded them, and the data stored in the measuring equipment was not linked to specific tests, controlled samples and batches.
As a result, due to inconsistency between the actions of different parts of the system (company divisions) and the lack of necessary knowledge, everyone loses. The owner invests in laboratory equipment with high measurement accuracy, perhaps unnecessary, throwing money down the drain, and the data recorded in the CIS are useless for their analysis in order to improve processes.
We generated values close to what we observed in the case described above with inadequate units of measurement, and to construct the control XmR-chart (Figure 1), we used values rounded to the nearest tenth (0.1).
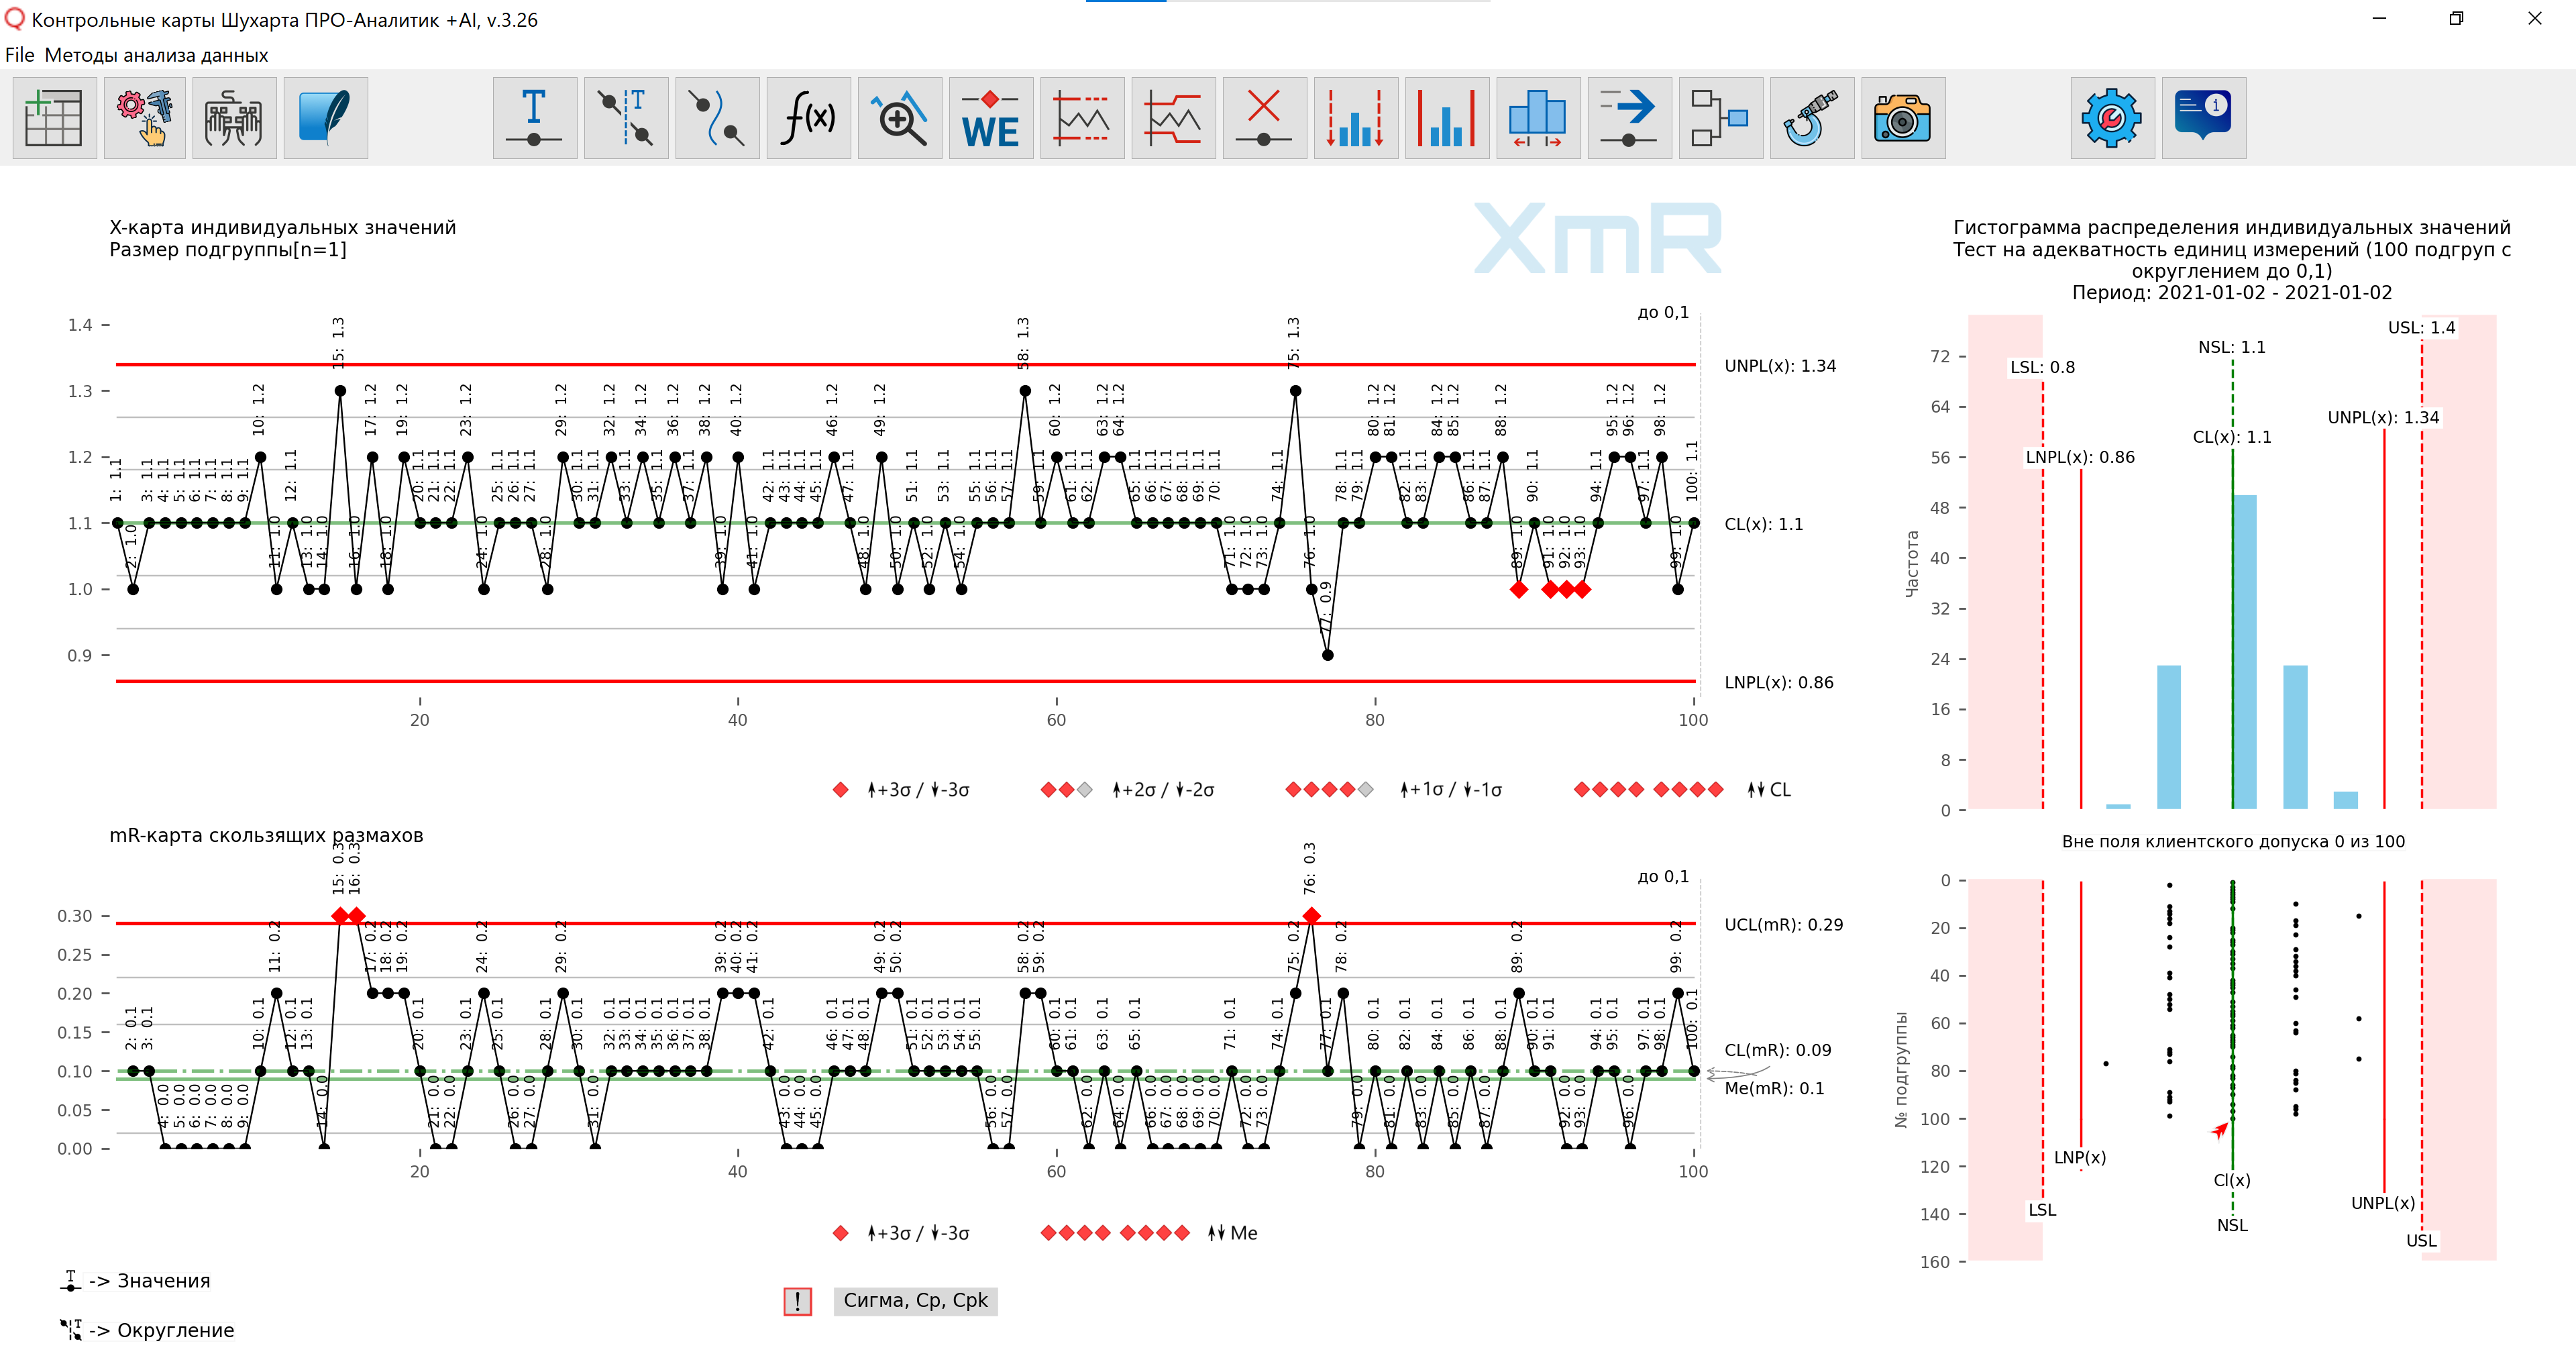
Rice. 1. XmR-chart built using inadequate units of measurement. The drawing was prepared using our developed “Shewhart control charts PRO-Analyst +AI (for Windows, Mac, Linux)” .
There is a simple operational definition of checking units of measurement for their adequacy. Donald Wheeler in his book “Statistical Process Control: Business Optimization Using Shewhart control charts” describes this rule as follows:
“If within the control limits on the mR chart of moving ranges for charts of individual values along the vertical axis, only 4 or 5 (five) possible values can be accommodated, the units of measurement are close to inadequate, 3 (three) or less - the units of measurement are clearly inadequate.
The problem of inadequate units of measurement (incorrect discrimination of several measurements due to the fact that the units of measurement are too large or insufficient) begins to negatively affect the control chart when the minimum increment of values (increment of the measuring system) exceeds the standard deviation of the process.
Control charts are at the edge of this problem when the standard deviation of the process is equal to the minimum value increment (measurement system increment)."
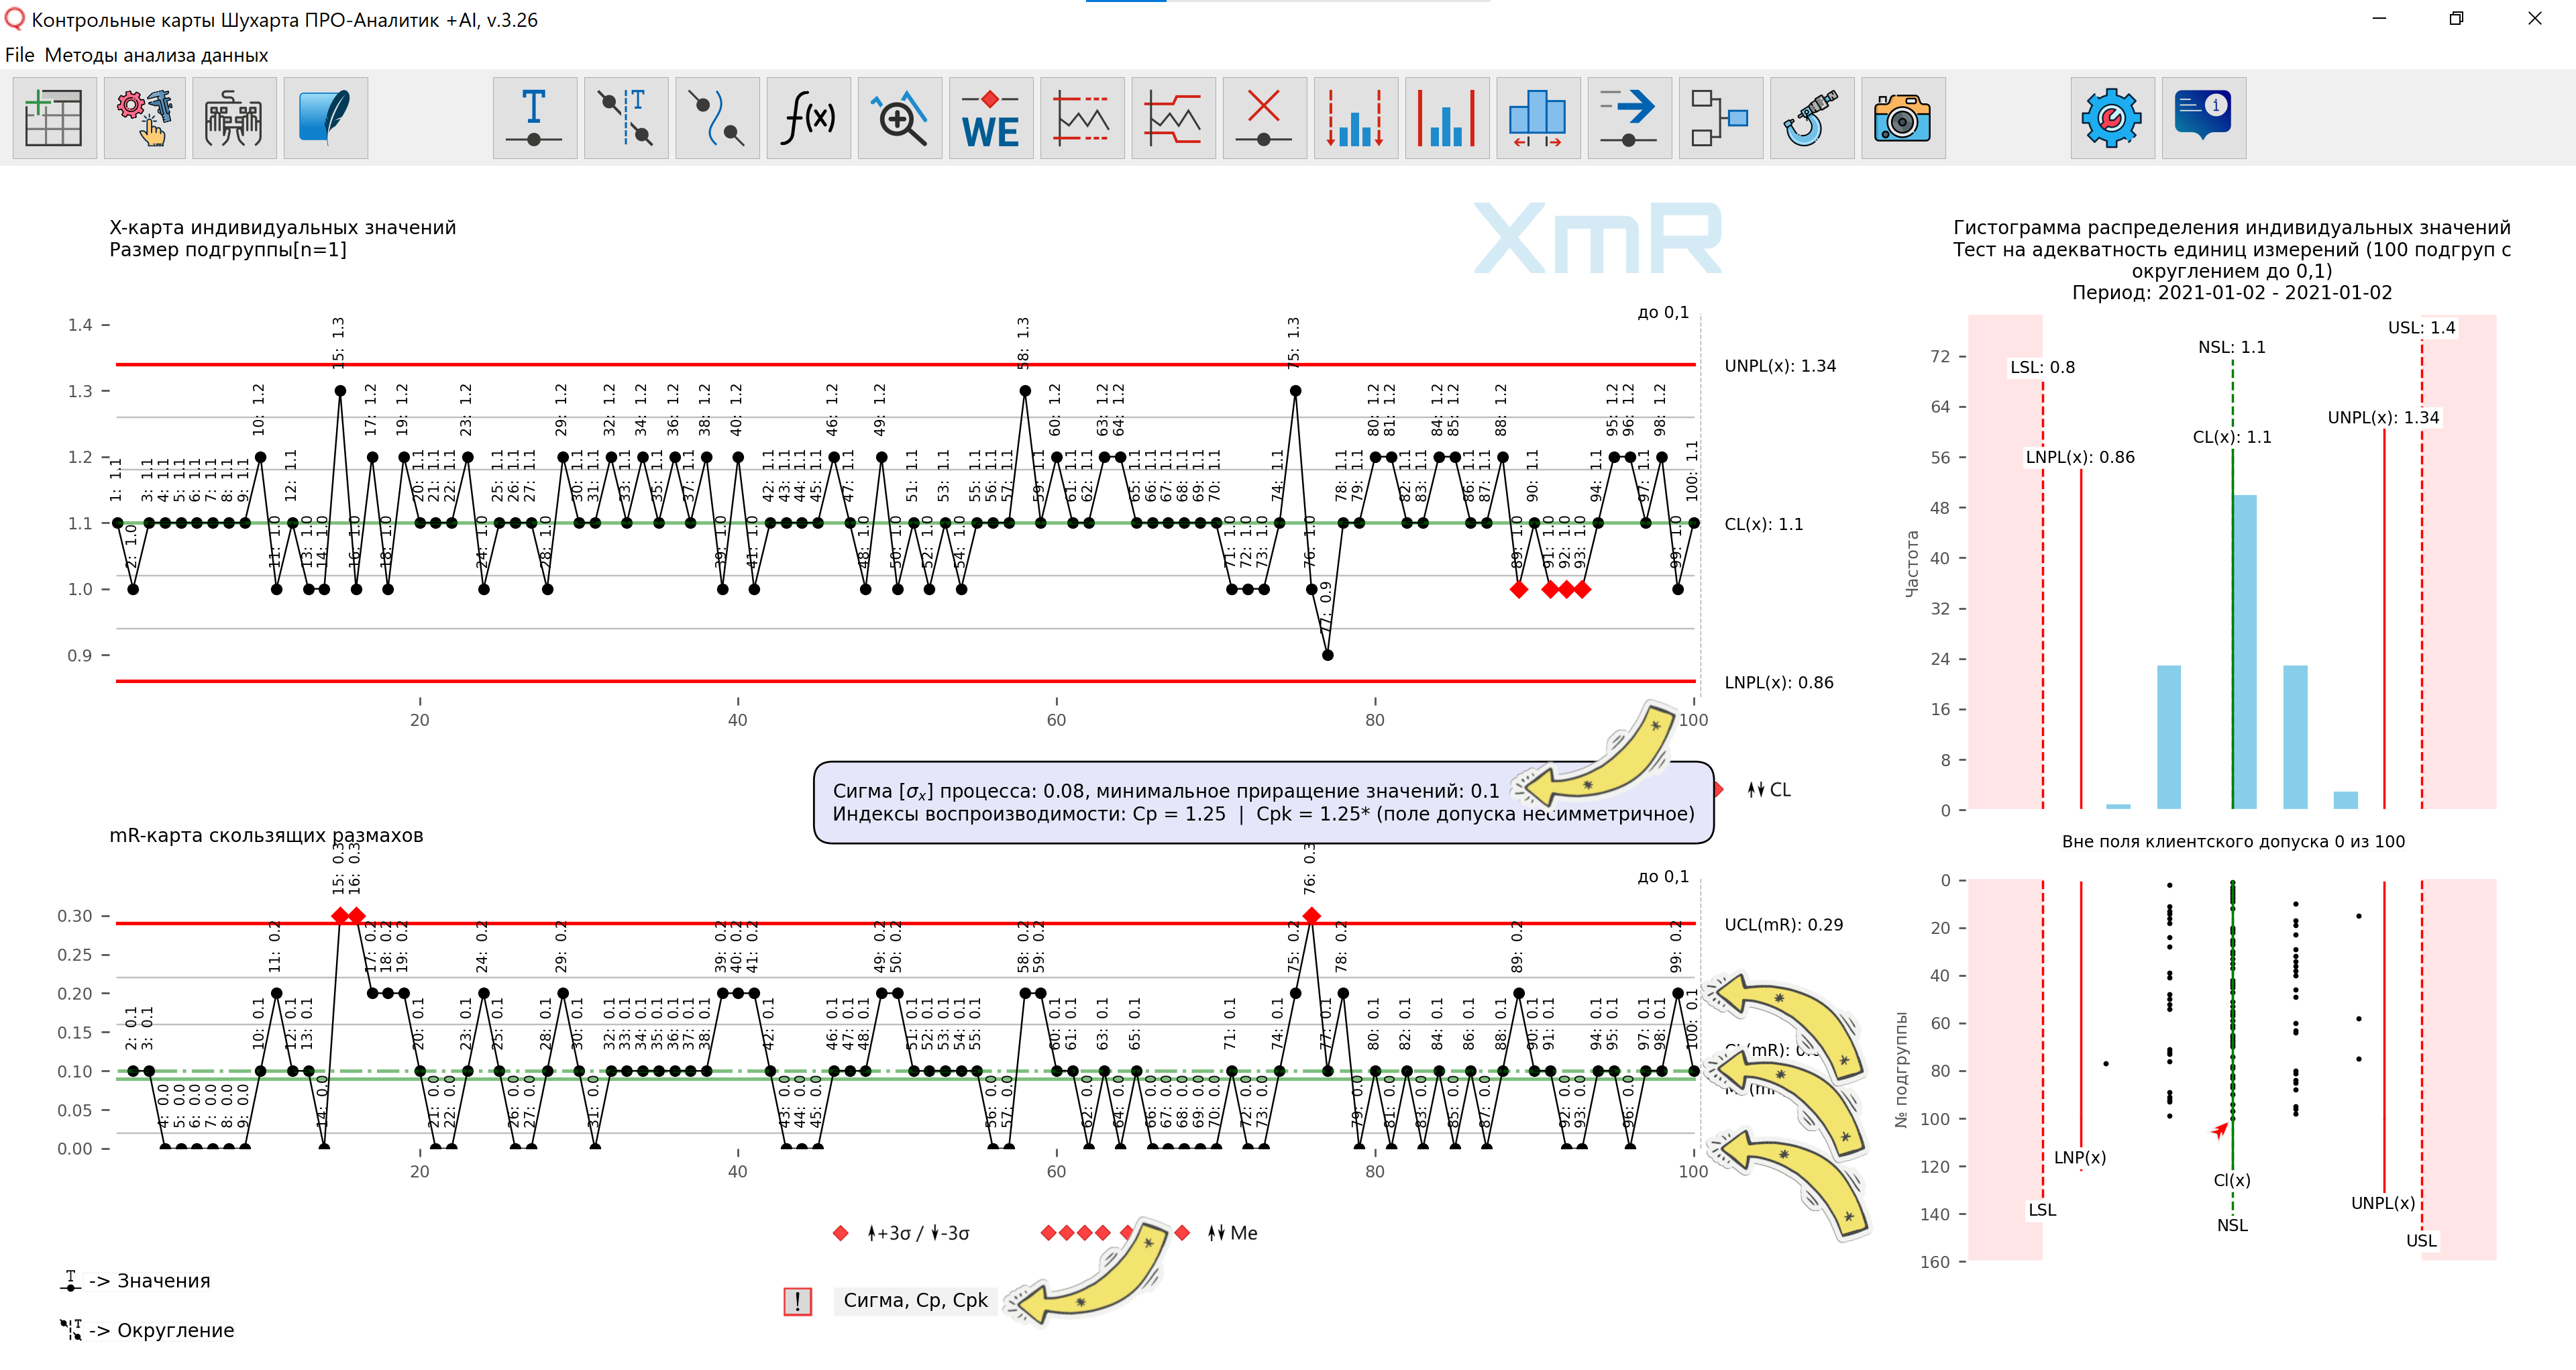
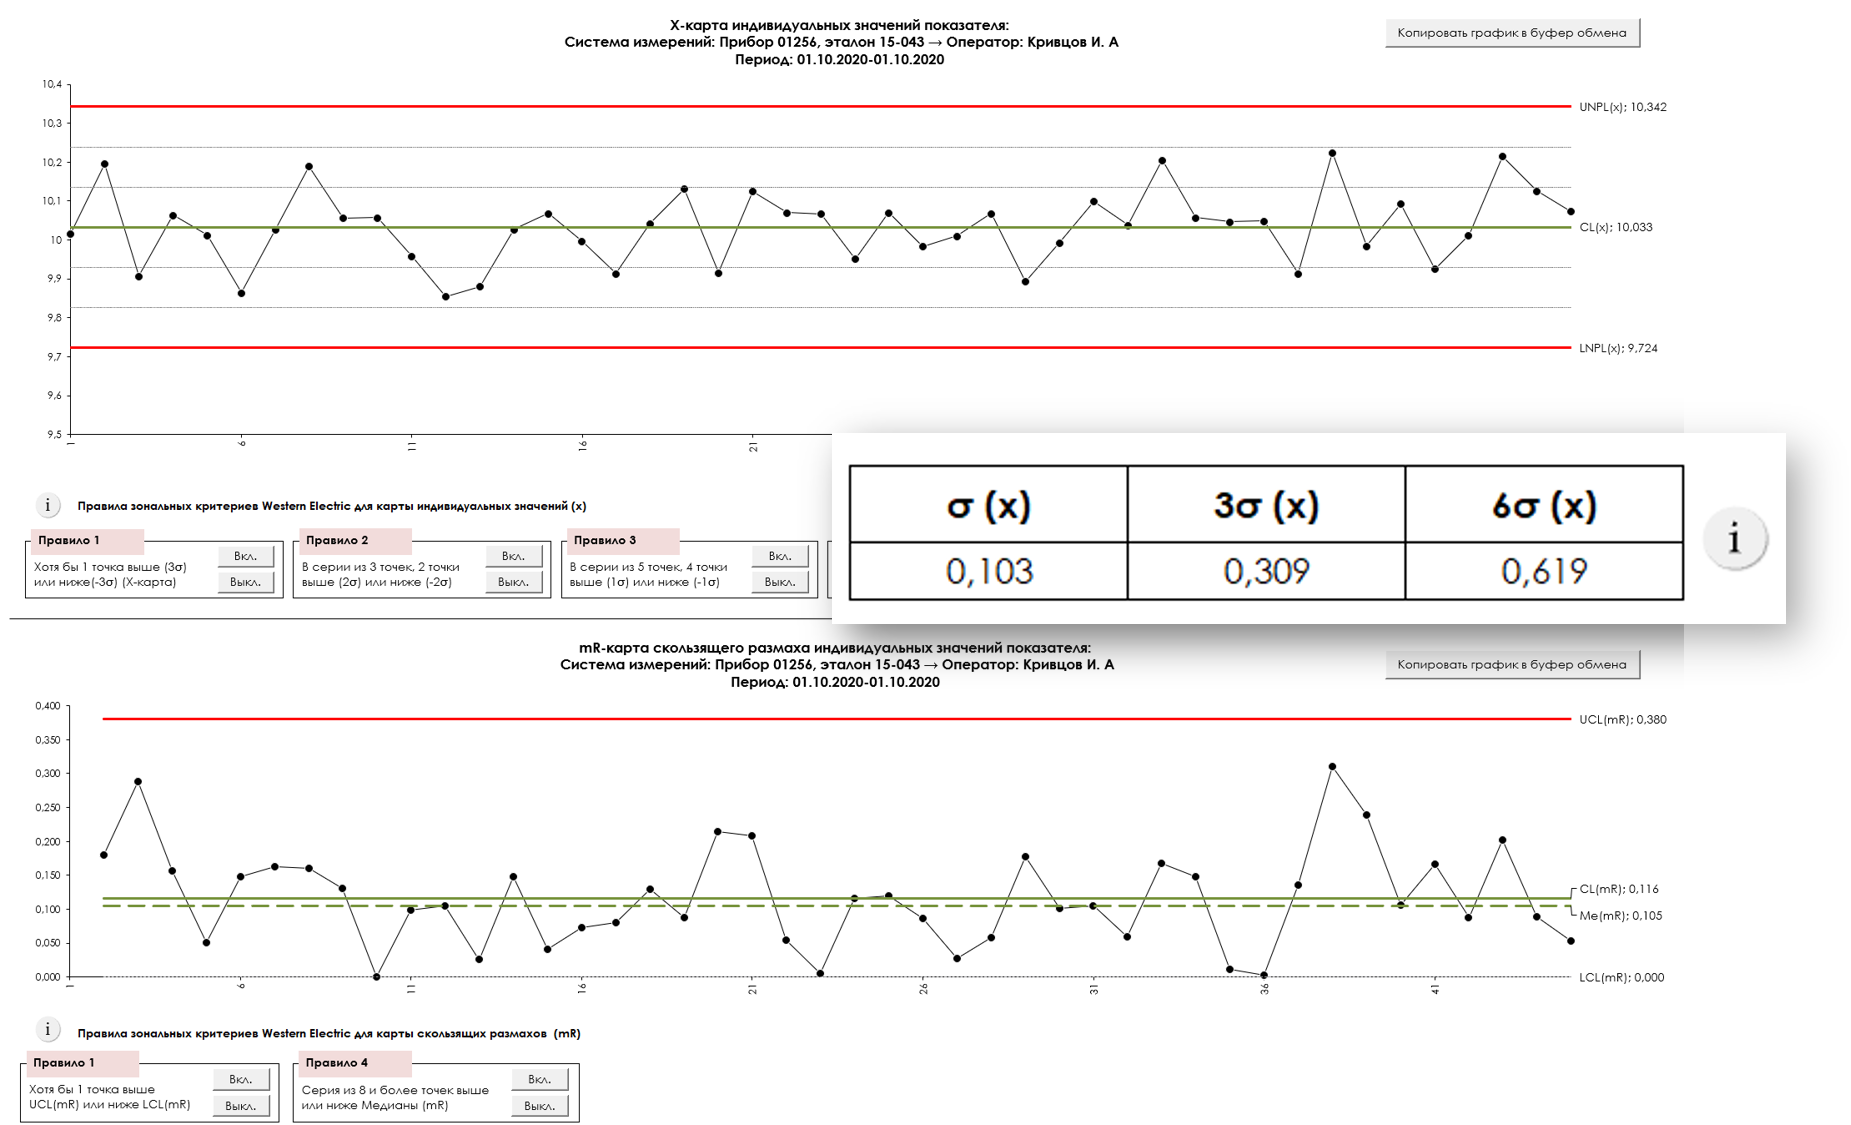
Rice. 2. Control XmR-chart of individual values, built using inadequate units of measurement, rounded to tenths (0.1). The arrows show the labels of 3 possible values within the control limits. The text block, which is displayed using the [Sigma, Cp, Cpk] button, indicates the standard deviation of the process and the minimum increment of values (increment of the measuring system). The drawing was prepared using our developed “Shewhart control charts PRO-Analyst +AI (for Windows, Mac, Linux)” .
For Figure 3, we rounded the values generated above to the nearest hundredth (0.01). The XmR-chart indicates that it is sufficient to increase the accuracy of the recorded measurements by just one sign from (0.1) to (0.01) for the data used in Figures 1 and 2 so that the visible “stepping” of the control chart graphs disappears.
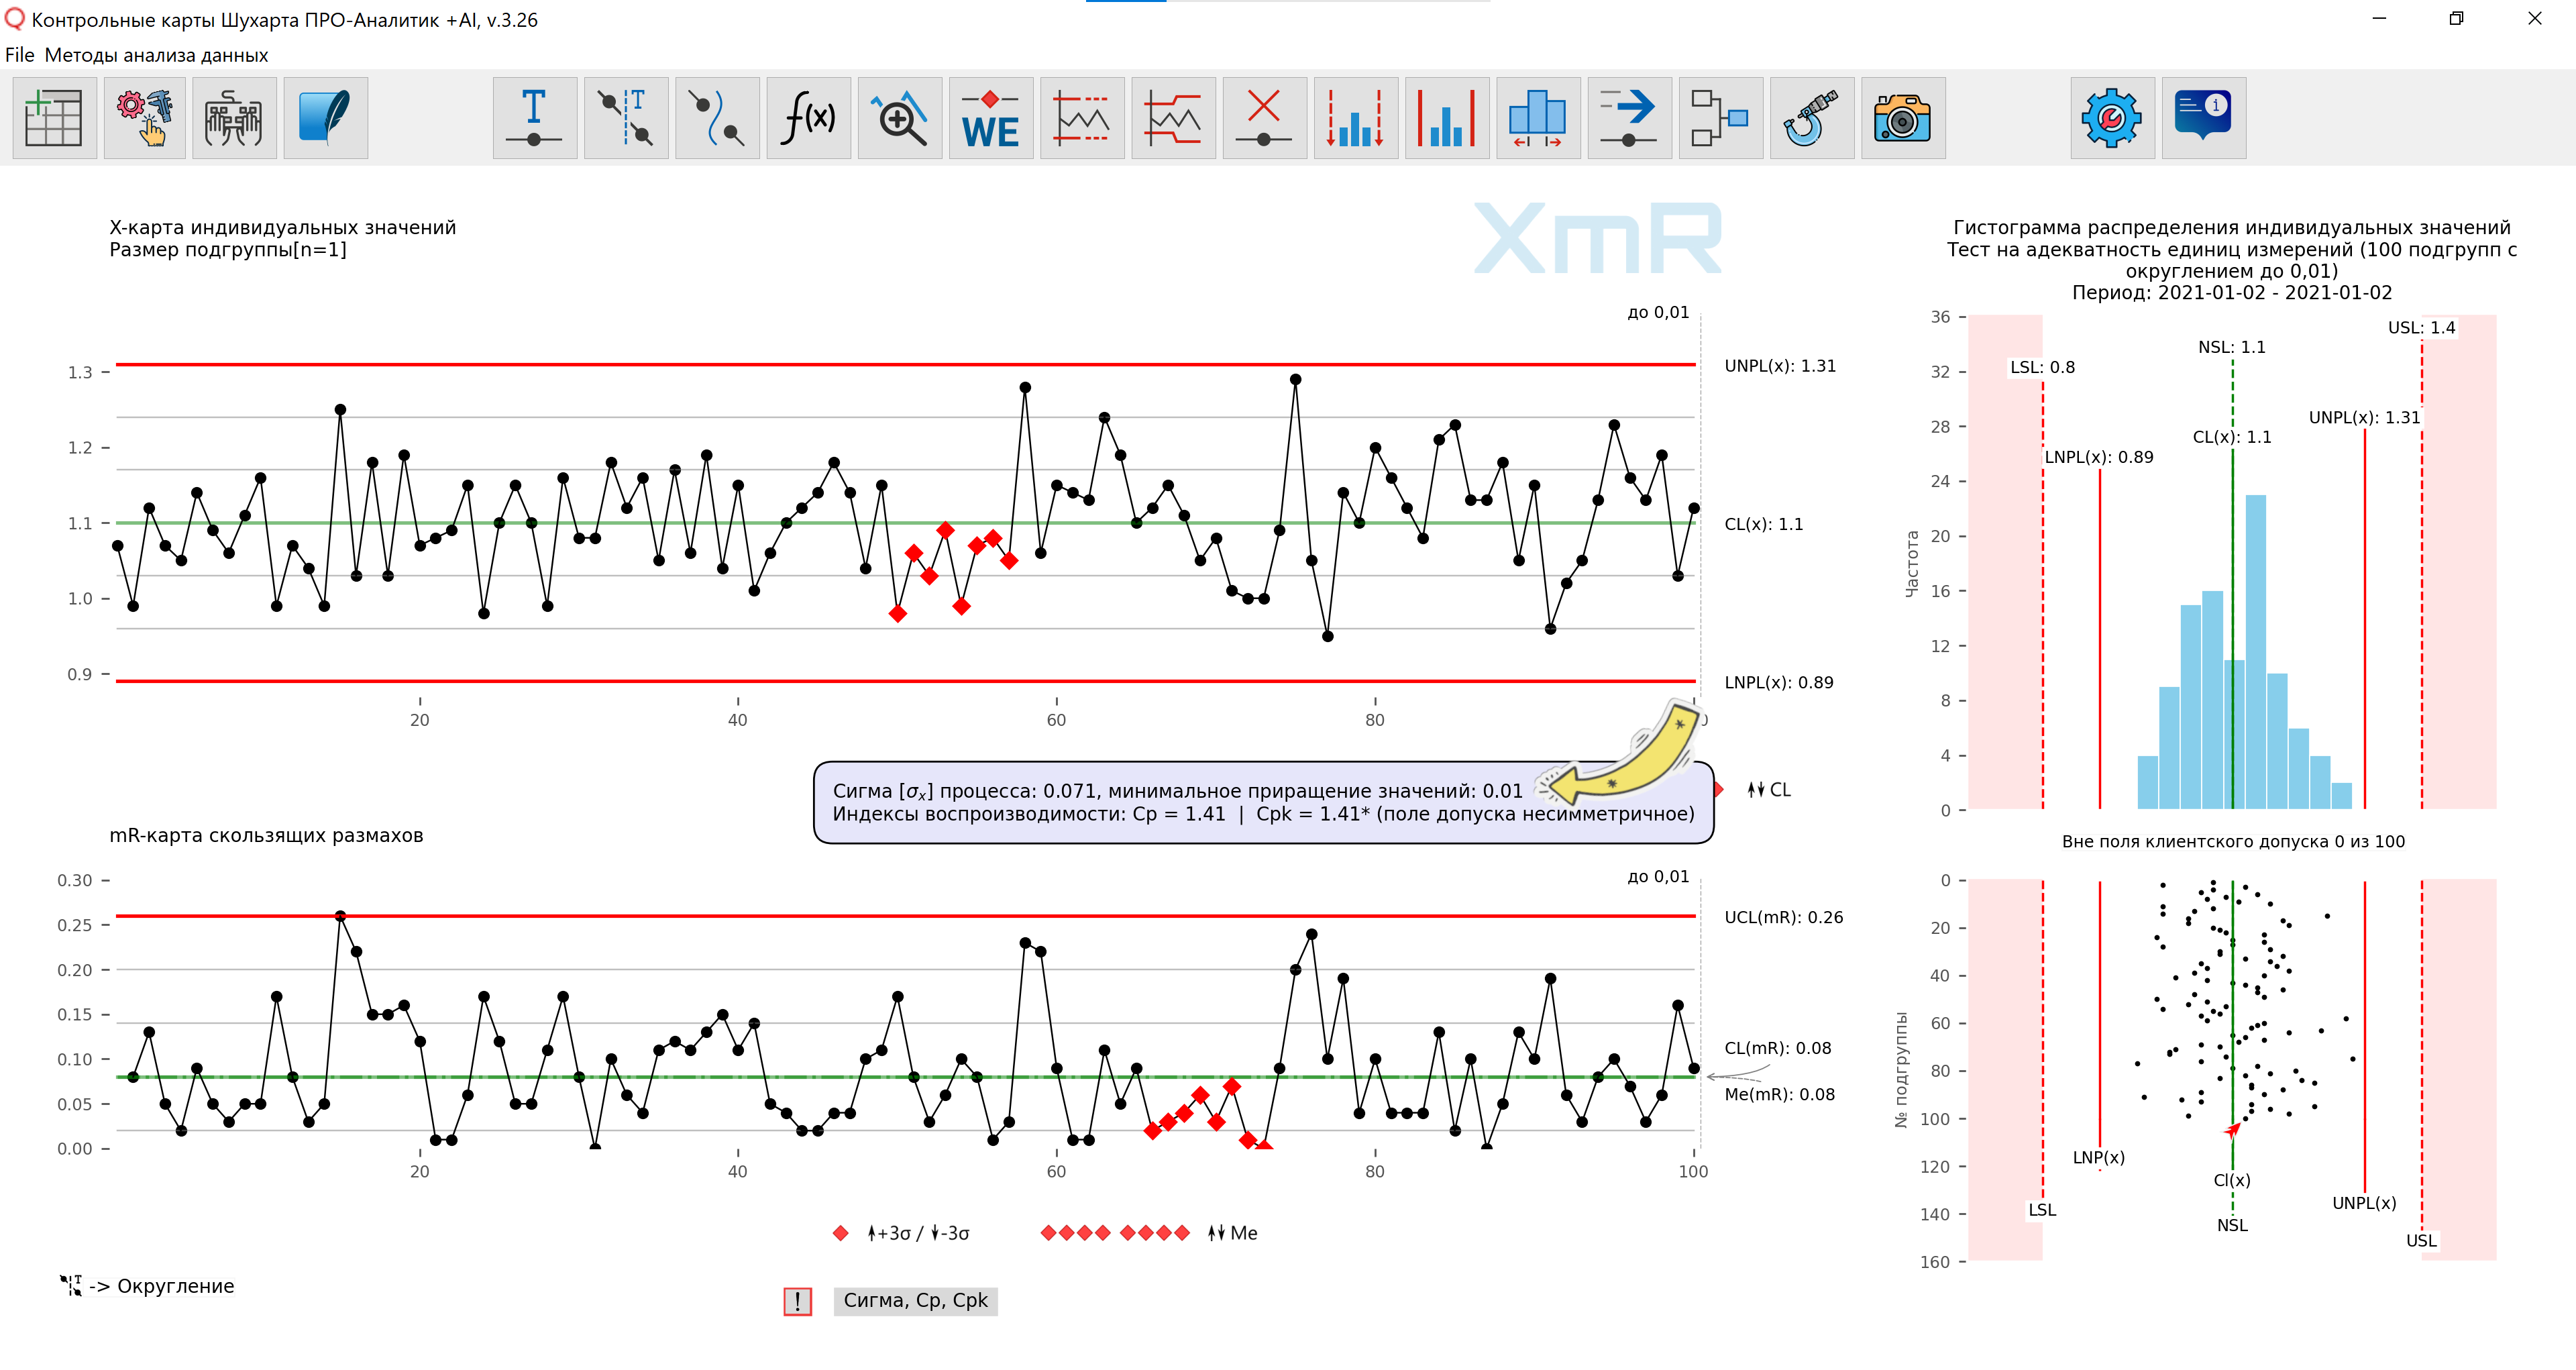
Rice. 3. Control XmR-chart of individual values, built using data rounded to the nearest hundredth (0.01). The drawing was prepared using our developed “Shewhart control charts PRO-Analyst +AI (for Windows, Mac, Linux)” .
In Figure 4, for clarity, we placed two data series on one control XmR card and using functions for constructing control limits for individual series Our software generated control limits for the two sets of data used in Figure 2 (rounded to 0.1) and Figure 3 (rounded to 0.01).
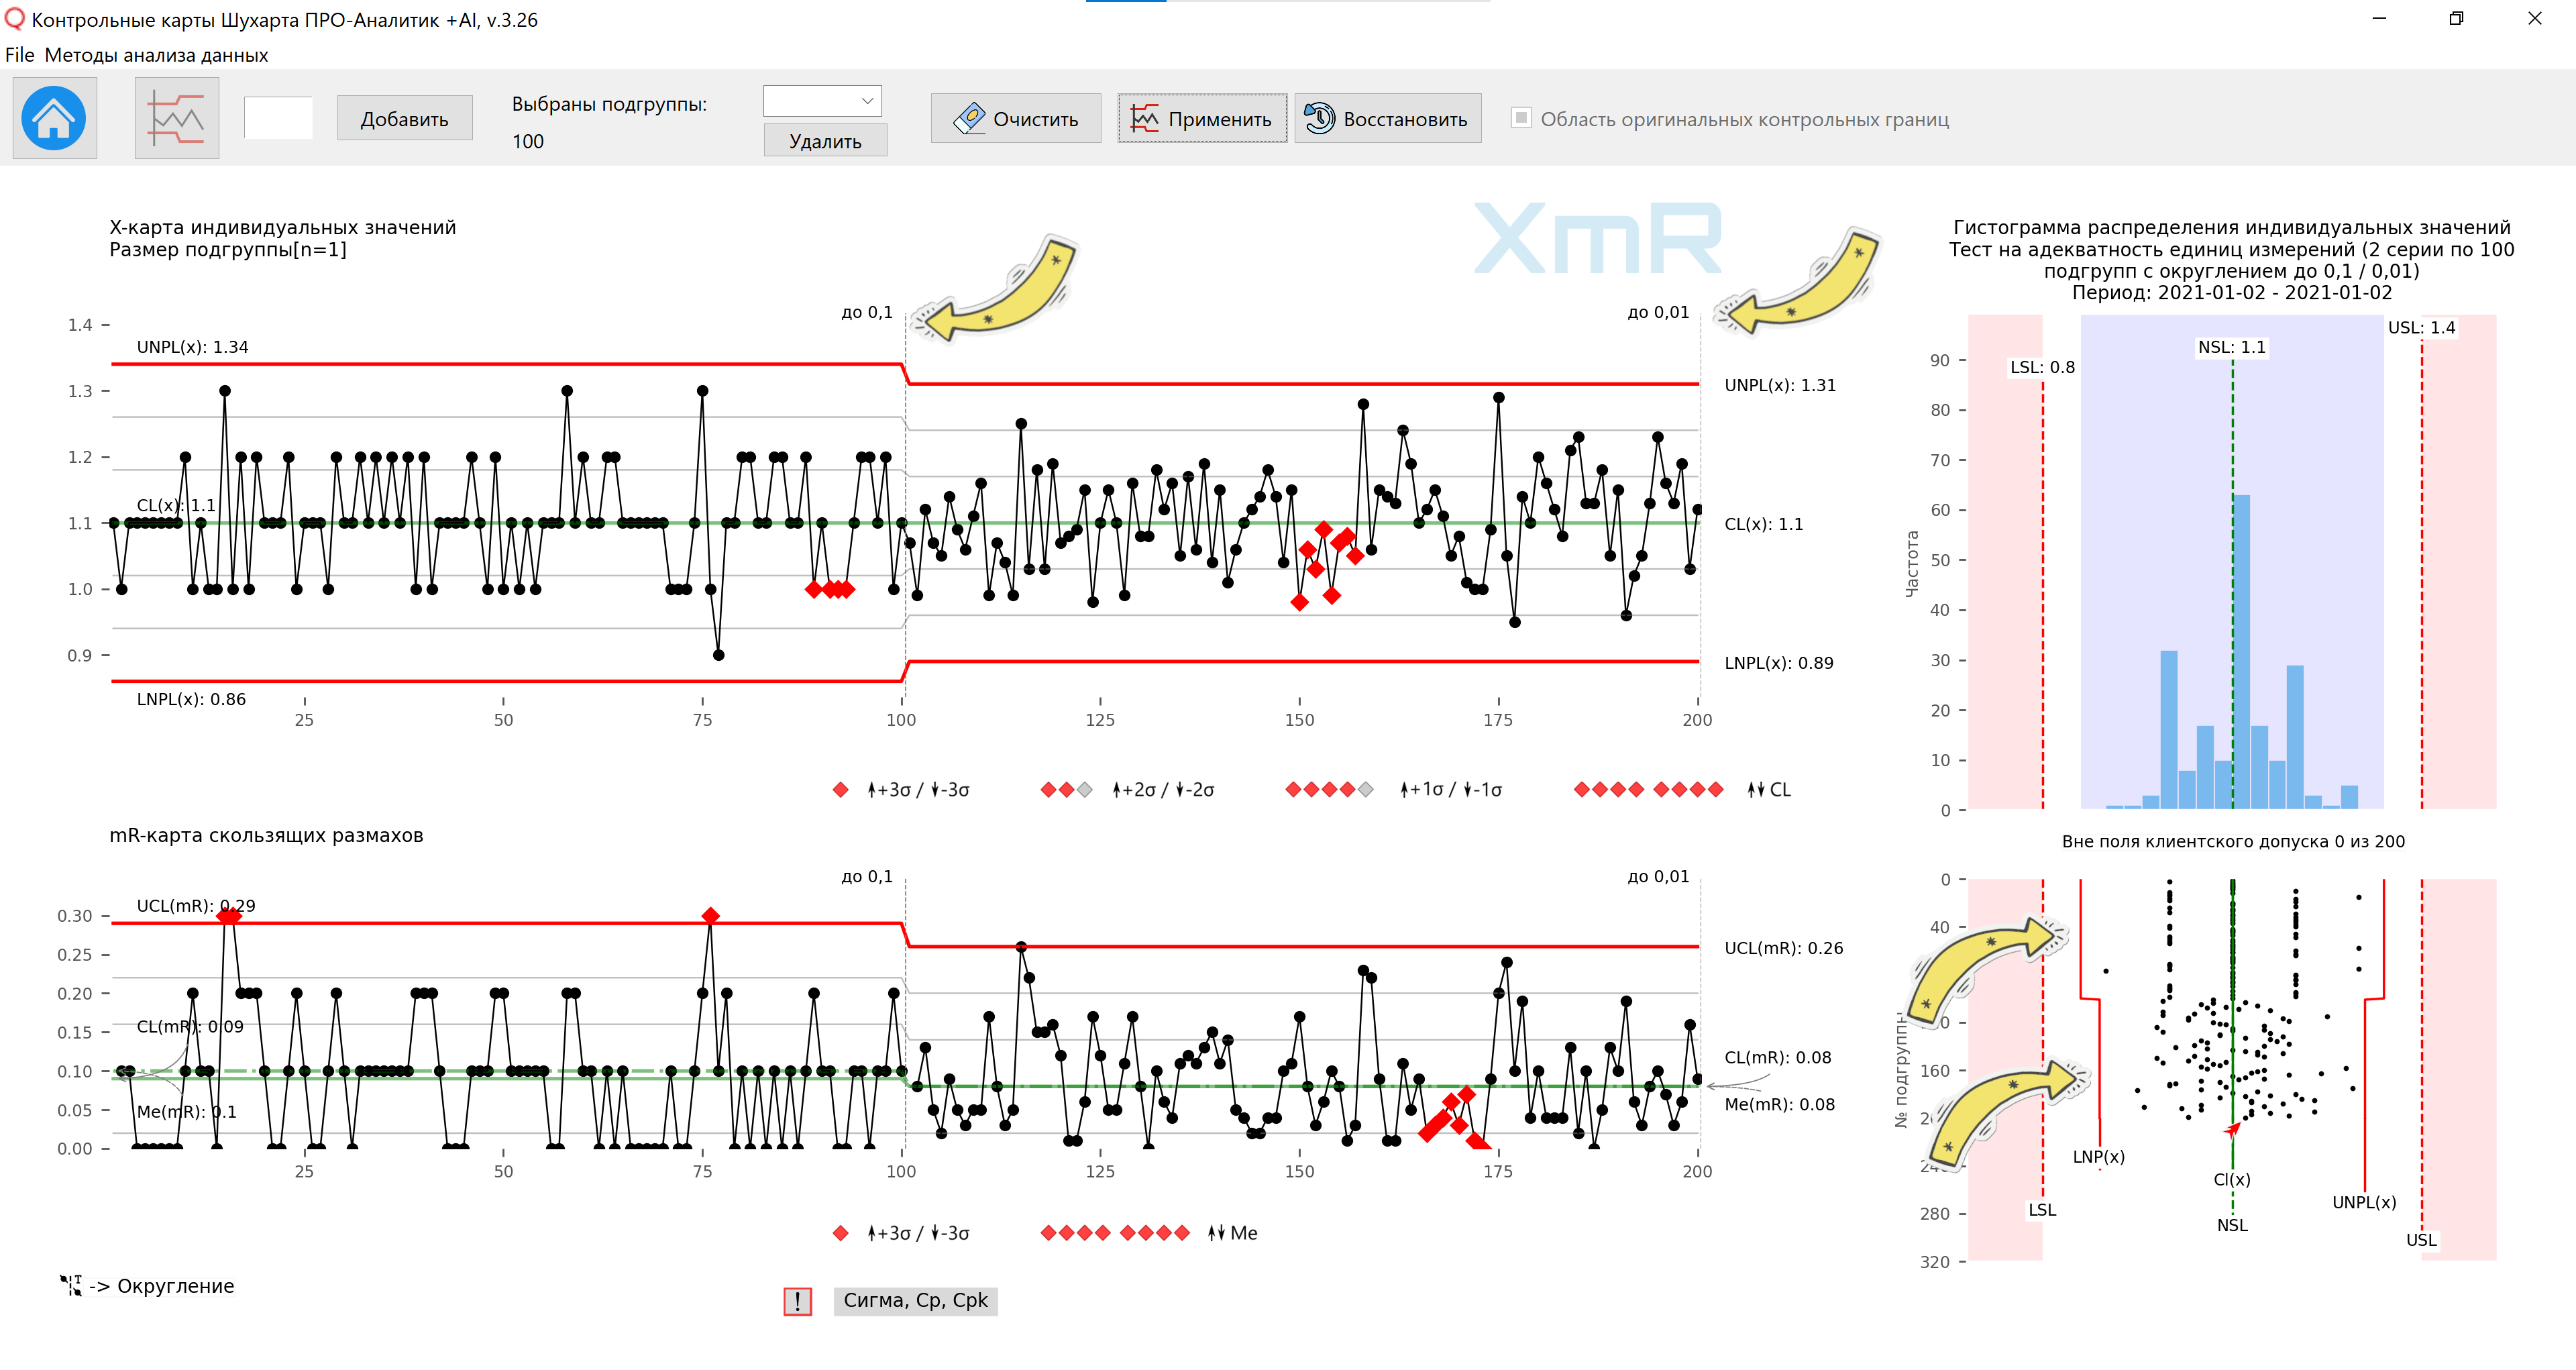
Rice. 4. Comparison of control XmR-charts of individual values constructed from data rounded to the nearest tenths (0.1) and hundredths (0.01). The drawing was prepared using our developed “Shewhart control charts PRO-Analyst +AI (for Windows, Mac, Linux)” .
Please note that inadequate units of measurement will result in red dot signals where adequate units would not produce red dots. Thus, inadequate units of measurement will force you to look for special causes where there are none. Conversely, you will not see red dot signals where they exist.
In essence, inadequate units of measurement lead to errors of the first and second kind .
Our software provides the simplest graphical tool that signals when to think about the adequacy of units of measurement - this is a simple scatter plot (below the histogram). The dots in Figure 5 on the left form ordered rows from top to bottom, rather than a random distribution of dots as in Figure 5 on the right.
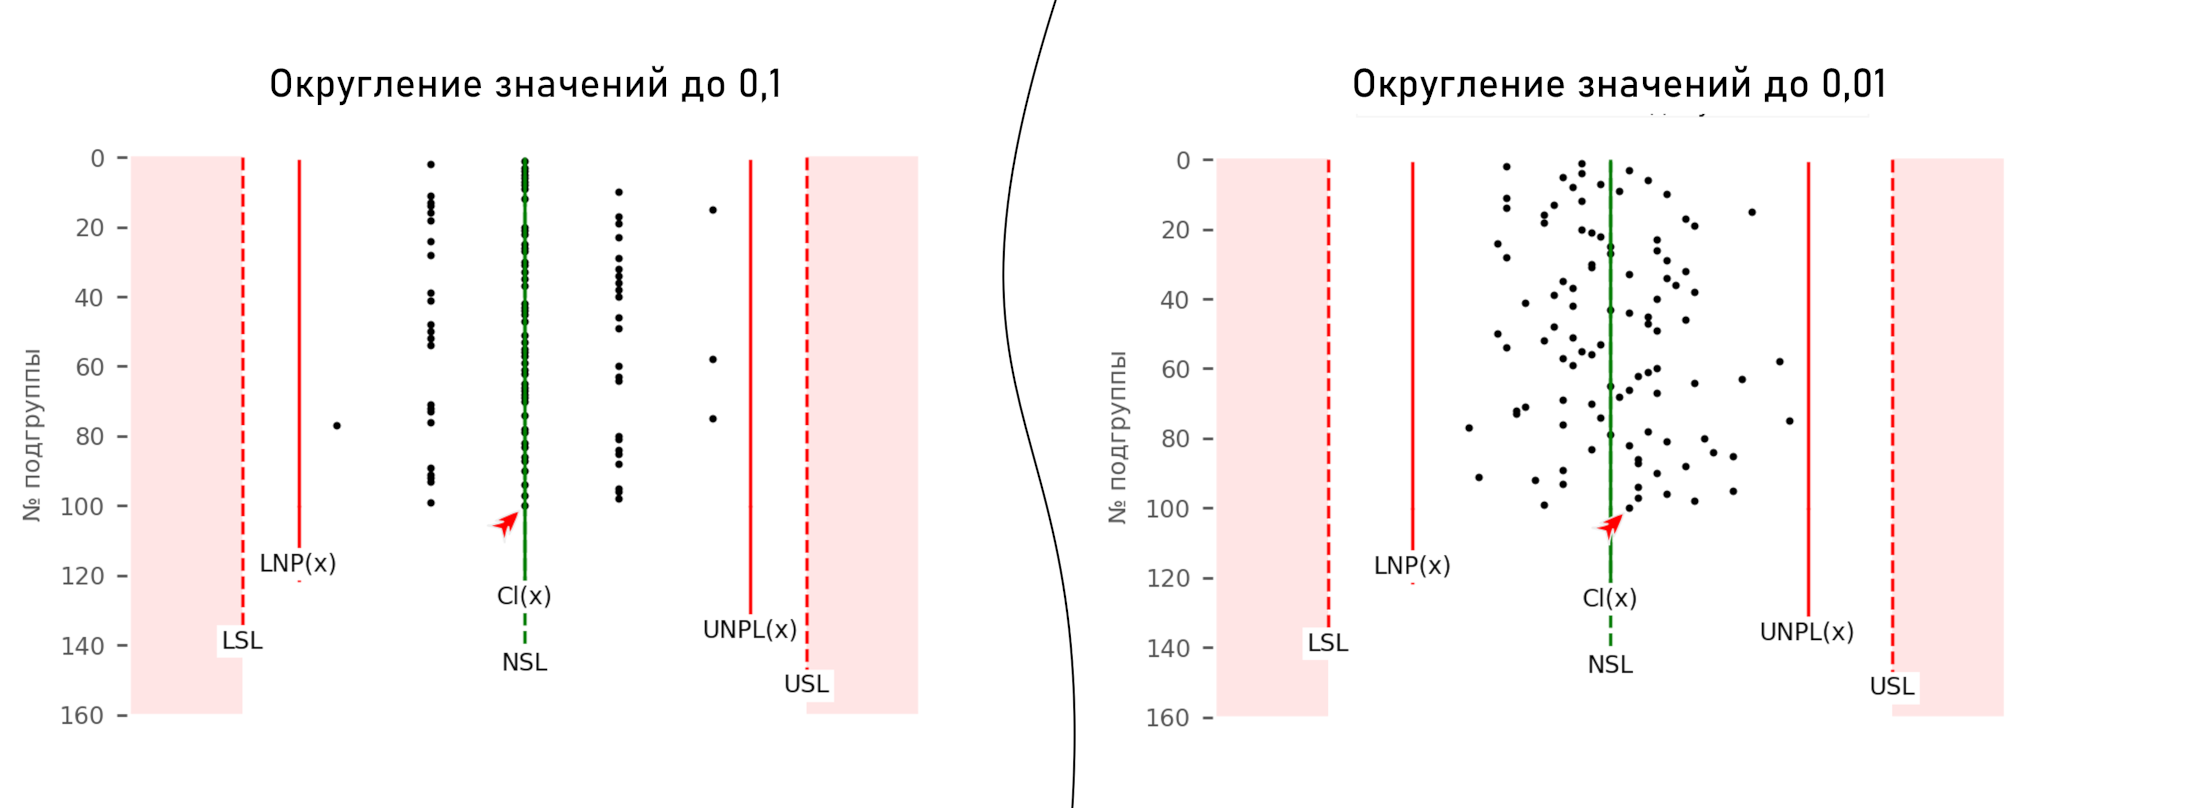
Rice. 5. The scatter plot on the left with ordered rows of dots indicates the level of unit inadequacy.
Donald Wheeler in the article we translated [20] Is this part acceptable? (DONALD J. WHEELER, Article: "Is the Part in Spec?") gives another operational definition of the required accuracy of recording measurements:
"The effective step of recording measurement values (minimum increment, increment) is in the range of values from 0.2 to 2 (two) probable errors (probable error) of the measurement system. Probable error (probable error) of the measurement system, in turn, is defined as 0.675×σ of a stable measuring system. Otherwise, when using a measurement step less than 0.2 probable error (probable error), we will record noise, and when recording with a step of more than two probable errors (probable error), we will lose information important for analysis, having received inadequate units of measurement."
Example
Given:
σ (sigma) of a stable measuring system: 0.103.
The σ value of the measuring system was obtained after constructing an XmR-chart (Figure 6), confirming its statistically stable state over 25 points of repeated measurement (test-retest) of the same known standard (reference).
Rice. 6. XmR control card for testing the measuring system (test-retest).
Solution:
- probable error of the measurement system 0.675×0.103=0.0695
- smallest effective measurement step 0.0695×0.2=0.0139
- largest effective measurement step 0.0695×2.0=0.139
The recommended effective measurement step is in the range:
from 0.0139 to 0.139.
Conclusion:
Thus, minimum steps (0.05) or (0.1) can be convenient to use and efficient to use. We chose (0,1) as the most convenient for use, see Figure 7.
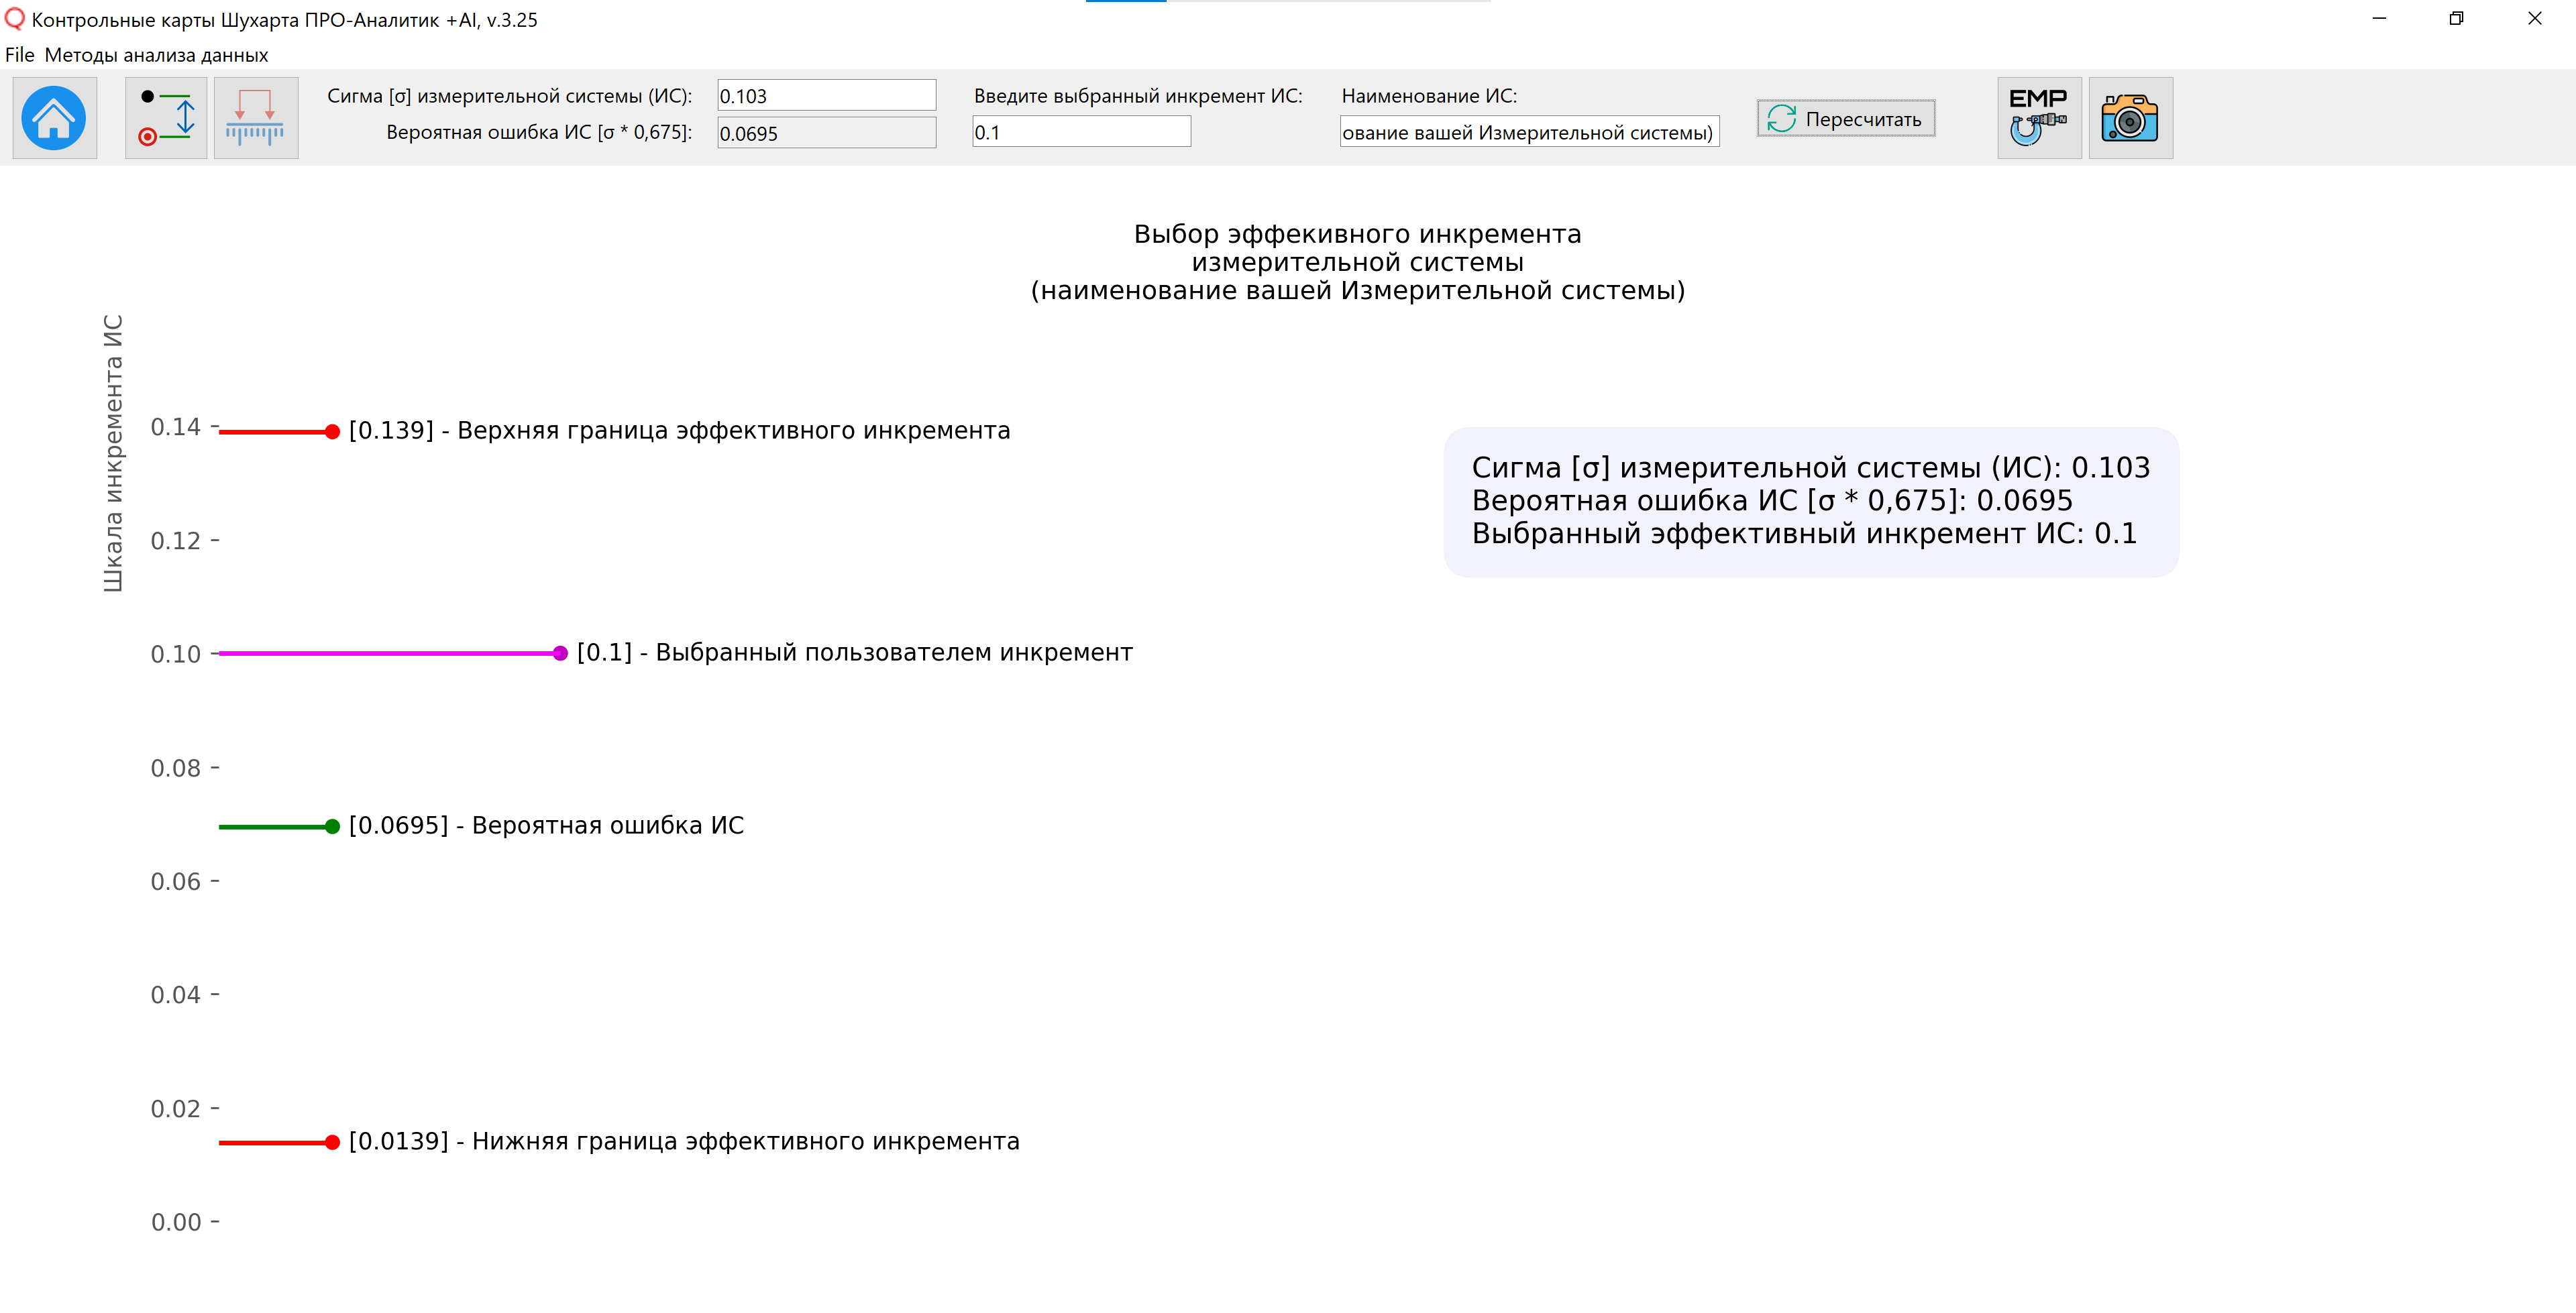
Figure 7. Selecting the effective measurement increment. The drawing was prepared using our developed “Shewhart control charts PRO-Analyst +AI (for Windows, Mac, Linux)” using the function: Determination of the effective increment (increment) of the measuring system .
If, after applying effective measurement increments (Figure 7), the control chart of the monitored indicator retains an obvious “step” (discreteness) as in Figure 1, most likely your measurement equipment needs to be replaced with a more accurate one (with more decimal places).
Take care to evaluate the accuracy of the recorded units of measurement for adequacy for improvement purposes using Shewhart control charts even before testing the manufactured products.