New machines, robotics and devices are not a panacea!
Material prepared by: Scientific Director of the AQT Center Sergey P. Grigoryev .
Free access to articles does not in any way diminish the value of the materials contained in them.
We present material on one of the most controversial topics in productivity and quality management - the passion for general robotization and the purchase of new equipment. When is the time to really think about purchasing new equipment?
"The assumption that by solving current problems, introducing automation, fixtures and new machines, we will transform industry
“Money can’t buy quality.”
The reason for writing this case was the article: “Duel of a painter and a robot.”
“Two years ago at the Trubodetal plant they tried to robotize the process of applying an anti-corrosion coating to pipeline connecting parts. They calculated: if you reduce the thickness of the coating by just 1 millimeter and apply the substance in an even layer, falling within the lowest limit of the norm, then you can get decent savings in a year .
Now this work at the plant is carried out by painters: they have a heavy paint gun in their hands, a hose (“boa constrictor”) is thrown over their necks, through which a two-component coating based on polyurea is supplied, their clothing is a white moisture-proof overalls, a mask on their face is almost a gas mask . Hard physical labor. Why not make it easier at the same time?
A universal robotic arm from a well-known company was brought for testing. You should have seen the duel that took place between the painter and the robot! The “one-armed bandit,” as the workers nicknamed him, was unable to apply the coating in an even layer, and even splashed a lot of urea resin on the sides - the consumption of coating components increased three times.
No matter how hard the representatives of the equipment integrator company fought, they still ended up defective. Although all the chances of winning the duel were on the robot’s side: the mechanical hand does not tremble, does not get tired of holding the spray gun, and it is neither hot nor cold. Meanwhile, the painter calmly finished painting his bend, watched how the machine struggled with a simple task, held its control panel in his hands - and went on to work.
The Trubodetal painters defeated the robot physically and mentally.
One good thing: the arrival of a steel competitor in the shop led to an unprecedented surge in labor productivity among painters. The yield rate from the first presentation immediately increased to 98–100 percent - and at the same time, the consumption of painting materials sharply decreased.
The plant hasn’t given up on the idea of robotizing this process – they just haven’t found a worthy proposal yet. It is noted here that buying a robot is not a question of its price. Everything is more complicated. At Trubodetal there is not a conveyor production, but a piece production, and a huge range of manufactured connecting parts - over a thousand standard sizes, therefore we need one universal robot that will independently “see” the geometry of the product, set the most economical paint supply mode, perform repeating operations, scan and remember result, he will learn from his own mistakes - and then, without the intervention of a programmer, he will quickly change over to painting a product of a completely different type and size, with a different specified coating thickness. Otherwise, you will need a separate robot for each type of product, which, of course, is a great luxury.”
A comment
The article clearly stands out from the modern information trend about the overall effectiveness of digitalization and robotization.
At the same time, the article demonstrates evidence of a misunderstanding of the nature of variability by Trubodetal employees:
“We calculated: if you reduce the thickness of the coating by just 1 millimeter and apply the substance in an even layer, falling within the lowest limit of the norm, then you can get decent savings in a year.”
Unfortunately, neither a person nor a robot will be able to “apply the substance in an even layer, falling within the lowest limit of the norm,” either now or in 50 years - this is impossible in the real variable world. Moreover, if painters aim for the “bottom line,” then about half the time the thickness will be less than the bottom line, provided the coating process is in a statistically controlled state (the best state the process is capable of) see Figure 1.
If the coating process is in a statistically unstable state, no one will be able to predict its results.
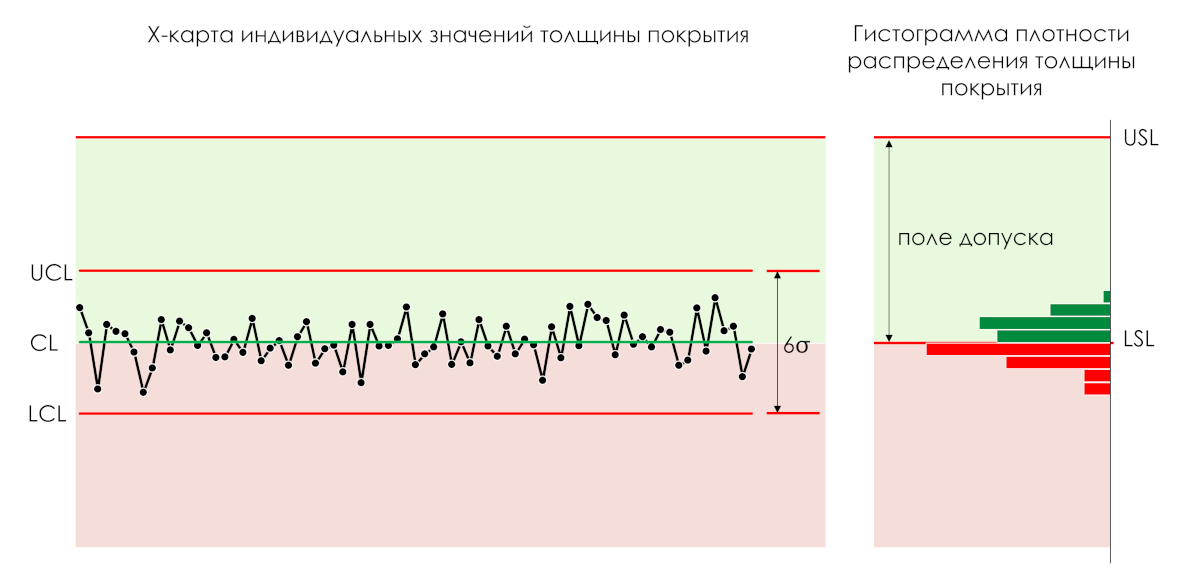
Figure 1. Shewhart control chart and distribution density histogram for stable process coating thickness values centered on the lower tolerance limit. UCL - upper control limit of the process, CL - central line of the process, LCL - lower control limit of the process, 6σ - process span, USL - upper limit of the tolerance field, LSL - lower limit of the tolerance field.
To understand my statement, it is critical to understand nature of variability , namely, that any properties of materials, “inputs” and “outputs” of processes are due to variability. For example, for the process of applying a two-component polyurea-based coating to the surface of parts, it is important to take into account the variability:
- quality indicators of each of the two coating components both within a batch and between supplier batches;
- quality indicators of the prepared two-component composition (mixture of components) of the coating before application to the surface to be treated;
- indicators of the quality of surface preparation for coating;
- environmental quality indicators in the coating chamber;
- quality indicators for applying a two-component coating to the surface of products, regardless of whether the person or robot applies the coating;
- measurement system (stability, measurement system error, consistency, bias) that you use to measure the quality of input materials, the quality of process operations, and the final output.
Of no less importance for improving processes, without the risk of worsening them, are operational definitions (methods, criteria, decision) that will be required to evaluate the variability of all components of the part coating process.
It is important to understand what the instrument you are using to determine coating thickness actually measures, namely, the minimum, average or maximum thickness in a certain area.
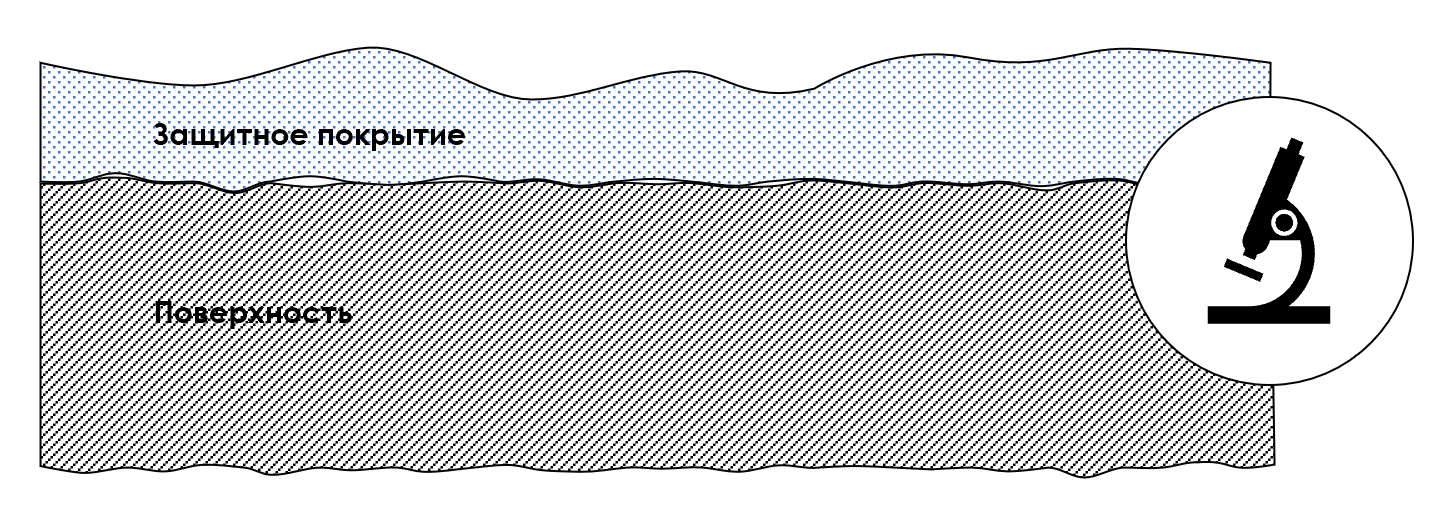
Figure 2. The thickness of the protective coating and the curvature of the protected surface when viewed under a microscope.
Additionally, you should have an idea of the error and offset of your measuring system
You can never get rid of variability, but you can work to reduce it. First of all, you will need to bring your processes to a statistically stable state. And if the tolerance field value is not regulated and good coating quality is ensured at the lower limit of the production tolerance field, then only after bringing the process into a statistically stable state by setting up the average process will you need to place the distribution of your coating thickness indicators (6σ wide fields) inside the production tolerance field as as close as possible to its lower limit with a safety gap between the lower process limit and the lower limit of the production tolerance. At the same time, it will be necessary to improve the protective coating to provide better protection at lower thicknesses and minimize variability in the coating process. When a decrease in variability is detected by the Shewhart control card, make another adjustment of the average, shifting it towards the lower limit of the production tolerance.
Figure 2. The correct way to set up the process in a non-nominal tolerance while minimizing the coating thickness.
For more details on the need to sort products into defective and non-defective with respect to production tolerances, which are fields of normal (customer) tolerances narrowed taking into account the error of the measuring system, see the article by Donald Wheeler: Is the product on specification actually compliant?
This approach to continuous improvement is fully consistent with the Shewhart-Deming PDSA Cycle (sometimes erroneously referred to as PDCA).
Video 1. Shewhart-Deming Cycle PDSA (Plan-Do-Study-Act, Deming Cycle), which underlies the main standard in the field of quality management ISO 9001, as well as a number of industry standards: IATF 16949 (automotive industry), ISO TS 22163 (IRIS - railway industry), EN/AS 9100 (aviation), GOST RV 15.002 (defense industry), STO GAZPROM 9001, etc. Often referred to as PDCA (Plan-Do-Check-Act).
"When I was first introduced to the concept of the PDSA cycle, within 15 minutes I thought I knew everything there was to know about this model. Now, after decades of active practice and study, I think that someday I will know enough about this concept ".
"Engineers and managers who ignore basic statistics simply cannot bring themselves to think about how to develop more reliable products, and must waste dollars trying to control production processes. When managers spend huge sums to get rid of the effects of variability, instead to learn how to reduce it, we call their approach "technology fix". If you learn to manage variability and protect your production from it, while your competitors are spending millions of dollars on fully automated processes that can handle uncertainty, obviously). "That you can undercut your competitors' prices. By reasoning in this way, we will understand why the NUMMI plant, equipped by Toyota for General Motors, is one of the highest quality plants, although the least automated."
For an explanation of the quote, see the article: Correct and incorrect ways to use tolerance fields. Should products be sorted according to tolerance margins for defective and non-defective, or should we try to customize the process?
When should you think about purchasing new equipment?
The decision about when it is really time to think about new equipment is presented by Edwards Deming in the preface to his book [2] Out of the Crisis, first published in 1982:
"An example of cost reduction.
Consider a speech that William Conway, president of Nashua Corporation, gave in Rio de Janeiro in March 1981:
“Our company's first big success came in March 1980, with improved quality and lower costs in the production of carbon-free copy paper.
A water-based coating containing various chemicals was applied to the paper as it unwound from the roll. If the coverage was sufficient, then the consumer could have a clear copy, which he received thanks to this paper several months later. The coating head uses approximately 3.6 lbs (1.63 kg) of dry coating per 3,000 sq. ft (280 m2) of paper at a rate of about 1,100 linear feet (335 m) per minute onto rolls 6 to 8 ft (2 to 2.5 m) wide. Adjusters take samples of paper and test them to determine the intensity (level of darkness) of the copy. These tests were conducted on freshly coated and oven-aged samples to simulate consumer use of the paper. When testing shows too little or too much coverage, the operator adjusts the head by increasing or decreasing the ink flow rate*. Stopping frequently for new adjustments has become a way of life. But these stops came at a cost.
The engineers were aware that the average coating layer was too high, but did not know how to reduce it without risking an unusable coating. The option of purchasing a new head was considered, which cost $700,000. This would mean, in addition to the $700,000 cost, a loss of installation time and the risk that the new installation would not provide better coating uniformity and cost-effectiveness than the existing one.
In August 1979, the plant director asked for help. It was found that if the head was left untouched, the results would be in statistical control with an average coverage of 3.6 pounds, give or take 0.4. Elimination of various causes of variation identified by points lying outside the control limits (Shewhart control chart) made it possible to reduce coating consumption while maintaining consistently good quality. By April 1980, flow had dropped to an average of 2.8 pounds per 3,000 square feet. ft., ranging from 2.4 to 3.2, resulting in a savings of 0.8 lbs per 3,000 sq. feet (3.6–2.8), or $800,000 per year at existing volumes and price levels.”
* The actions of these people tuning the head comply with Rule 2 or Rule 3 (see. "Monte Carlo Experiment with Funnel and Target" ), thereby sharply increasing the spread of coating thickness, i.e., they obtained a result exactly the opposite of what they were striving for.
Innovation for process improvement.
The end of the story told by Mr. Conway is more interesting. Statistical control paved the way for engineering innovation. Without it, the process was in a state of chaos where the results of any attempts at improvement could not be measured. And the statistical office allowed engineers and chemists to be inventive and creative. They now had a transparent and measurable process. They modified the chemical composition of the coating and learned to use less material each time. Reducing consumption by one-tenth of a pound means cutting material costs by $100,000 per year.
Engineers have also improved the head design to achieve greater coverage uniformity. All this time, statistical process control led to a thinner coating layer with an ever-decreasing spread of values.
New machines and devices are not a panacea. We have just looked at an example in which important results in quality and productivity were achieved because people learned to use equipment efficiently.
Editorials and letters to newspapers attributed America's declining productivity levels to inadequate use of new equipment and devices, as well as new types of automatic machines such as robots. Such essays are interesting to read, and even more interesting to write to people who know nothing about production problems.
The following paragraph, borrowed from a letter from a friend of mine, an employee of a large manufacturing company, can serve as an illustration of what has been said:
“This whole program (the development and installation of new machines) is unsuccessful. All these excellent machines performed their functions during testing, but when they started working in our factories, they stopped so often and due to such serious breakdowns that the total costs, instead of decline, rushed upward. No one had previously assessed the likely number of failures and repairs. As a result, we were in a frenzy due to downtime and insufficient reserves of spare parts, and even due to their absence, alternative production lines were not envisaged."
Automation tools and automatic data recording in the office and factory are also not a solution. Exhibitions where such equipment is displayed are attended by thousands of people looking for an easy way to overcome the productivity gap, who believe in life-saving equipment. Some technology can only pay for itself, but the combined effect of new machines, devices and brilliant ideas is only a small part of the qualitative improvements that the management of companies that have overcome decline must provide.
If I were a banker, I would not lend money for new equipment until the company applying for the loan provides statistical evidence that it is using the full potential of existing equipment, working on 14 points and fights with deadly diseases and obstacles ".

Figure 2. Screenshot of Elon Musk's tweet (Elon Musk, Twitter).