Is the product meeting the specification (approval) actually meeting the specification? Are defective products really defective?
Article prepared by: Scientific Director of the AQT Center
Sergey P. Grigoryev
using materials kindly provided to him by Donald Wheeler:
[19] Where do manufacturing specifications come from? (Where Do Manufacturing Specifications Come From?)
[20] Is this part in tolerance? (Is the Part in Spec?)
Free access to articles does not in any way diminish the value of the materials contained in them.
"Over the last 20 years, it has become fashionable to condemn measurement processes that are not perfect. However, the reality is that we must always use imperfect data. Given this fact of life, how can we know if the object being measured is within specifications (tolerances)? In other words, how can we correct for error? measurement systems when describing a product regarding tolerance fields?
Production
Losses due to the presence of boundary values
Products in boundary values, due to the inevitable error of the measurement system, will always have uncertainty whether the product is actually defective or not. Please note that the number of products with boundary values will increase with the deterioration of process centering relative to the tolerance limits (Fig. 1 and Fig. 2) and will decrease with decreasing width of the distribution of the controlled parameter (Fig. 3). This is especially important if you have to categorize products as passable or unfit within your tolerance limits or specifications before shipping to the customer.
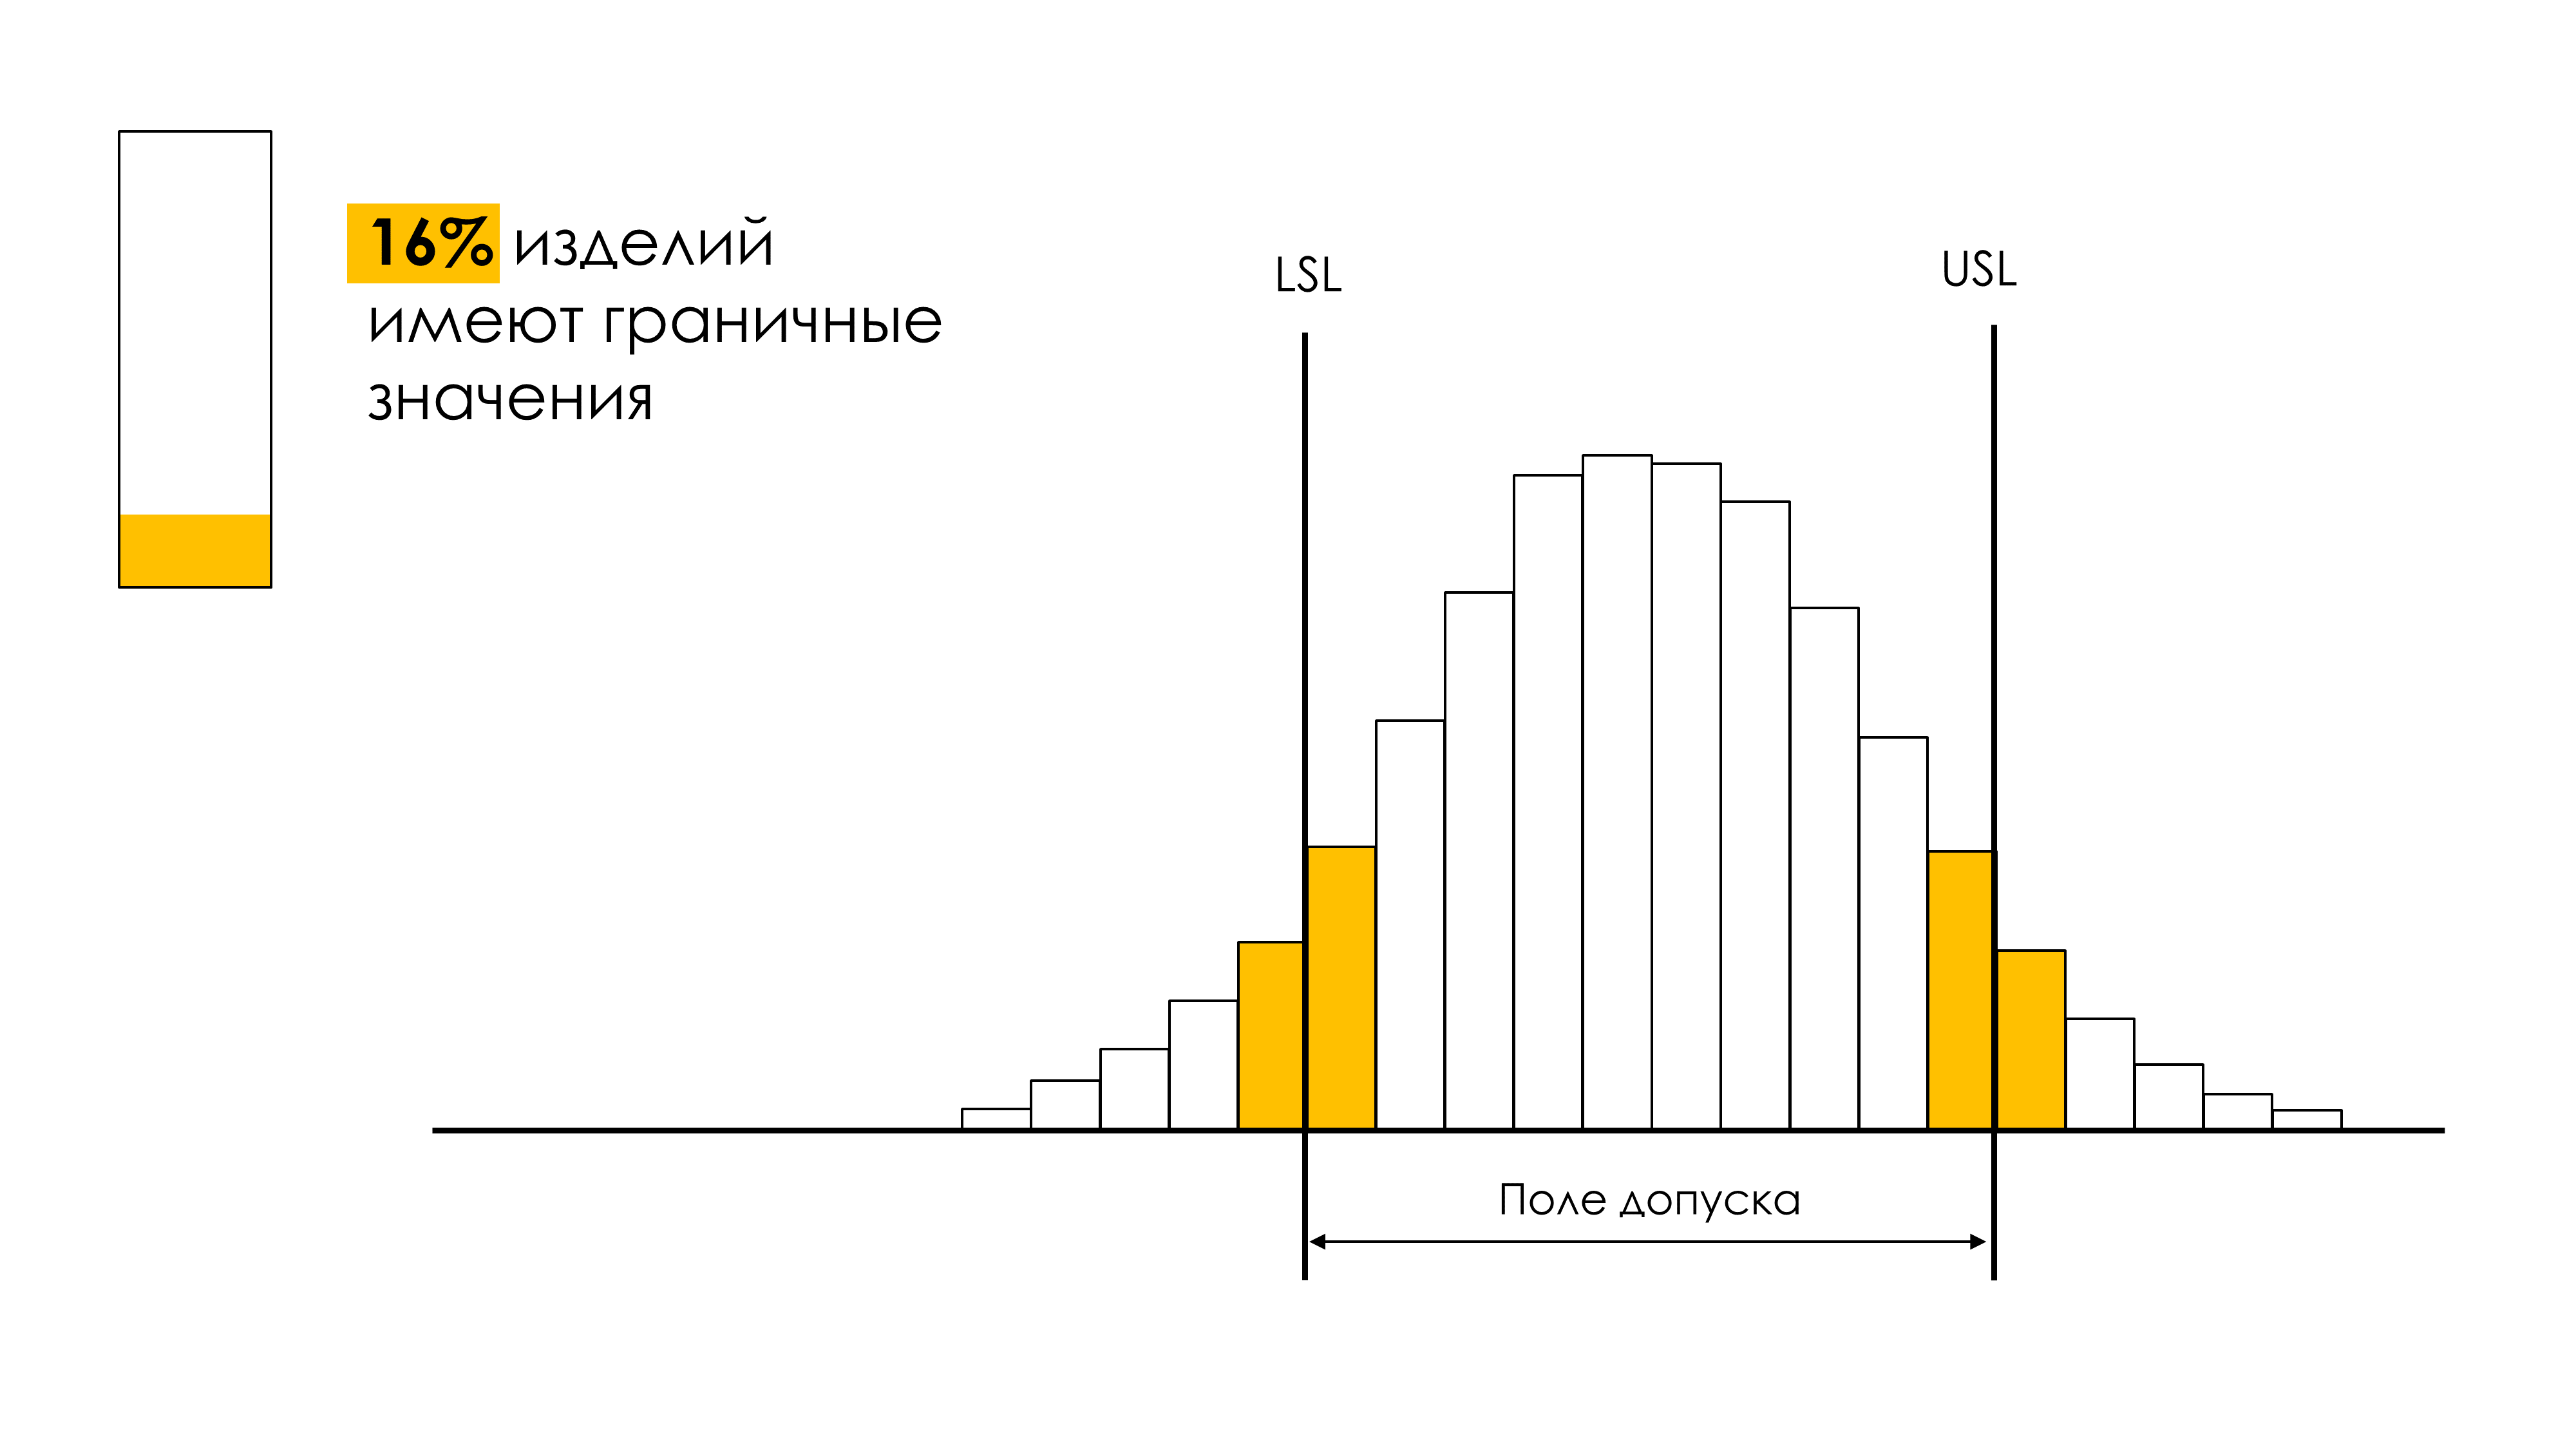
Figure 1. Boundary products (products at the boundaries of the tolerance zone) of a process operating wider than the tolerance zone - 1.
Legend: LSL and USL - lower and upper tolerance limits (specifications). The process is well centered in the tolerance field.
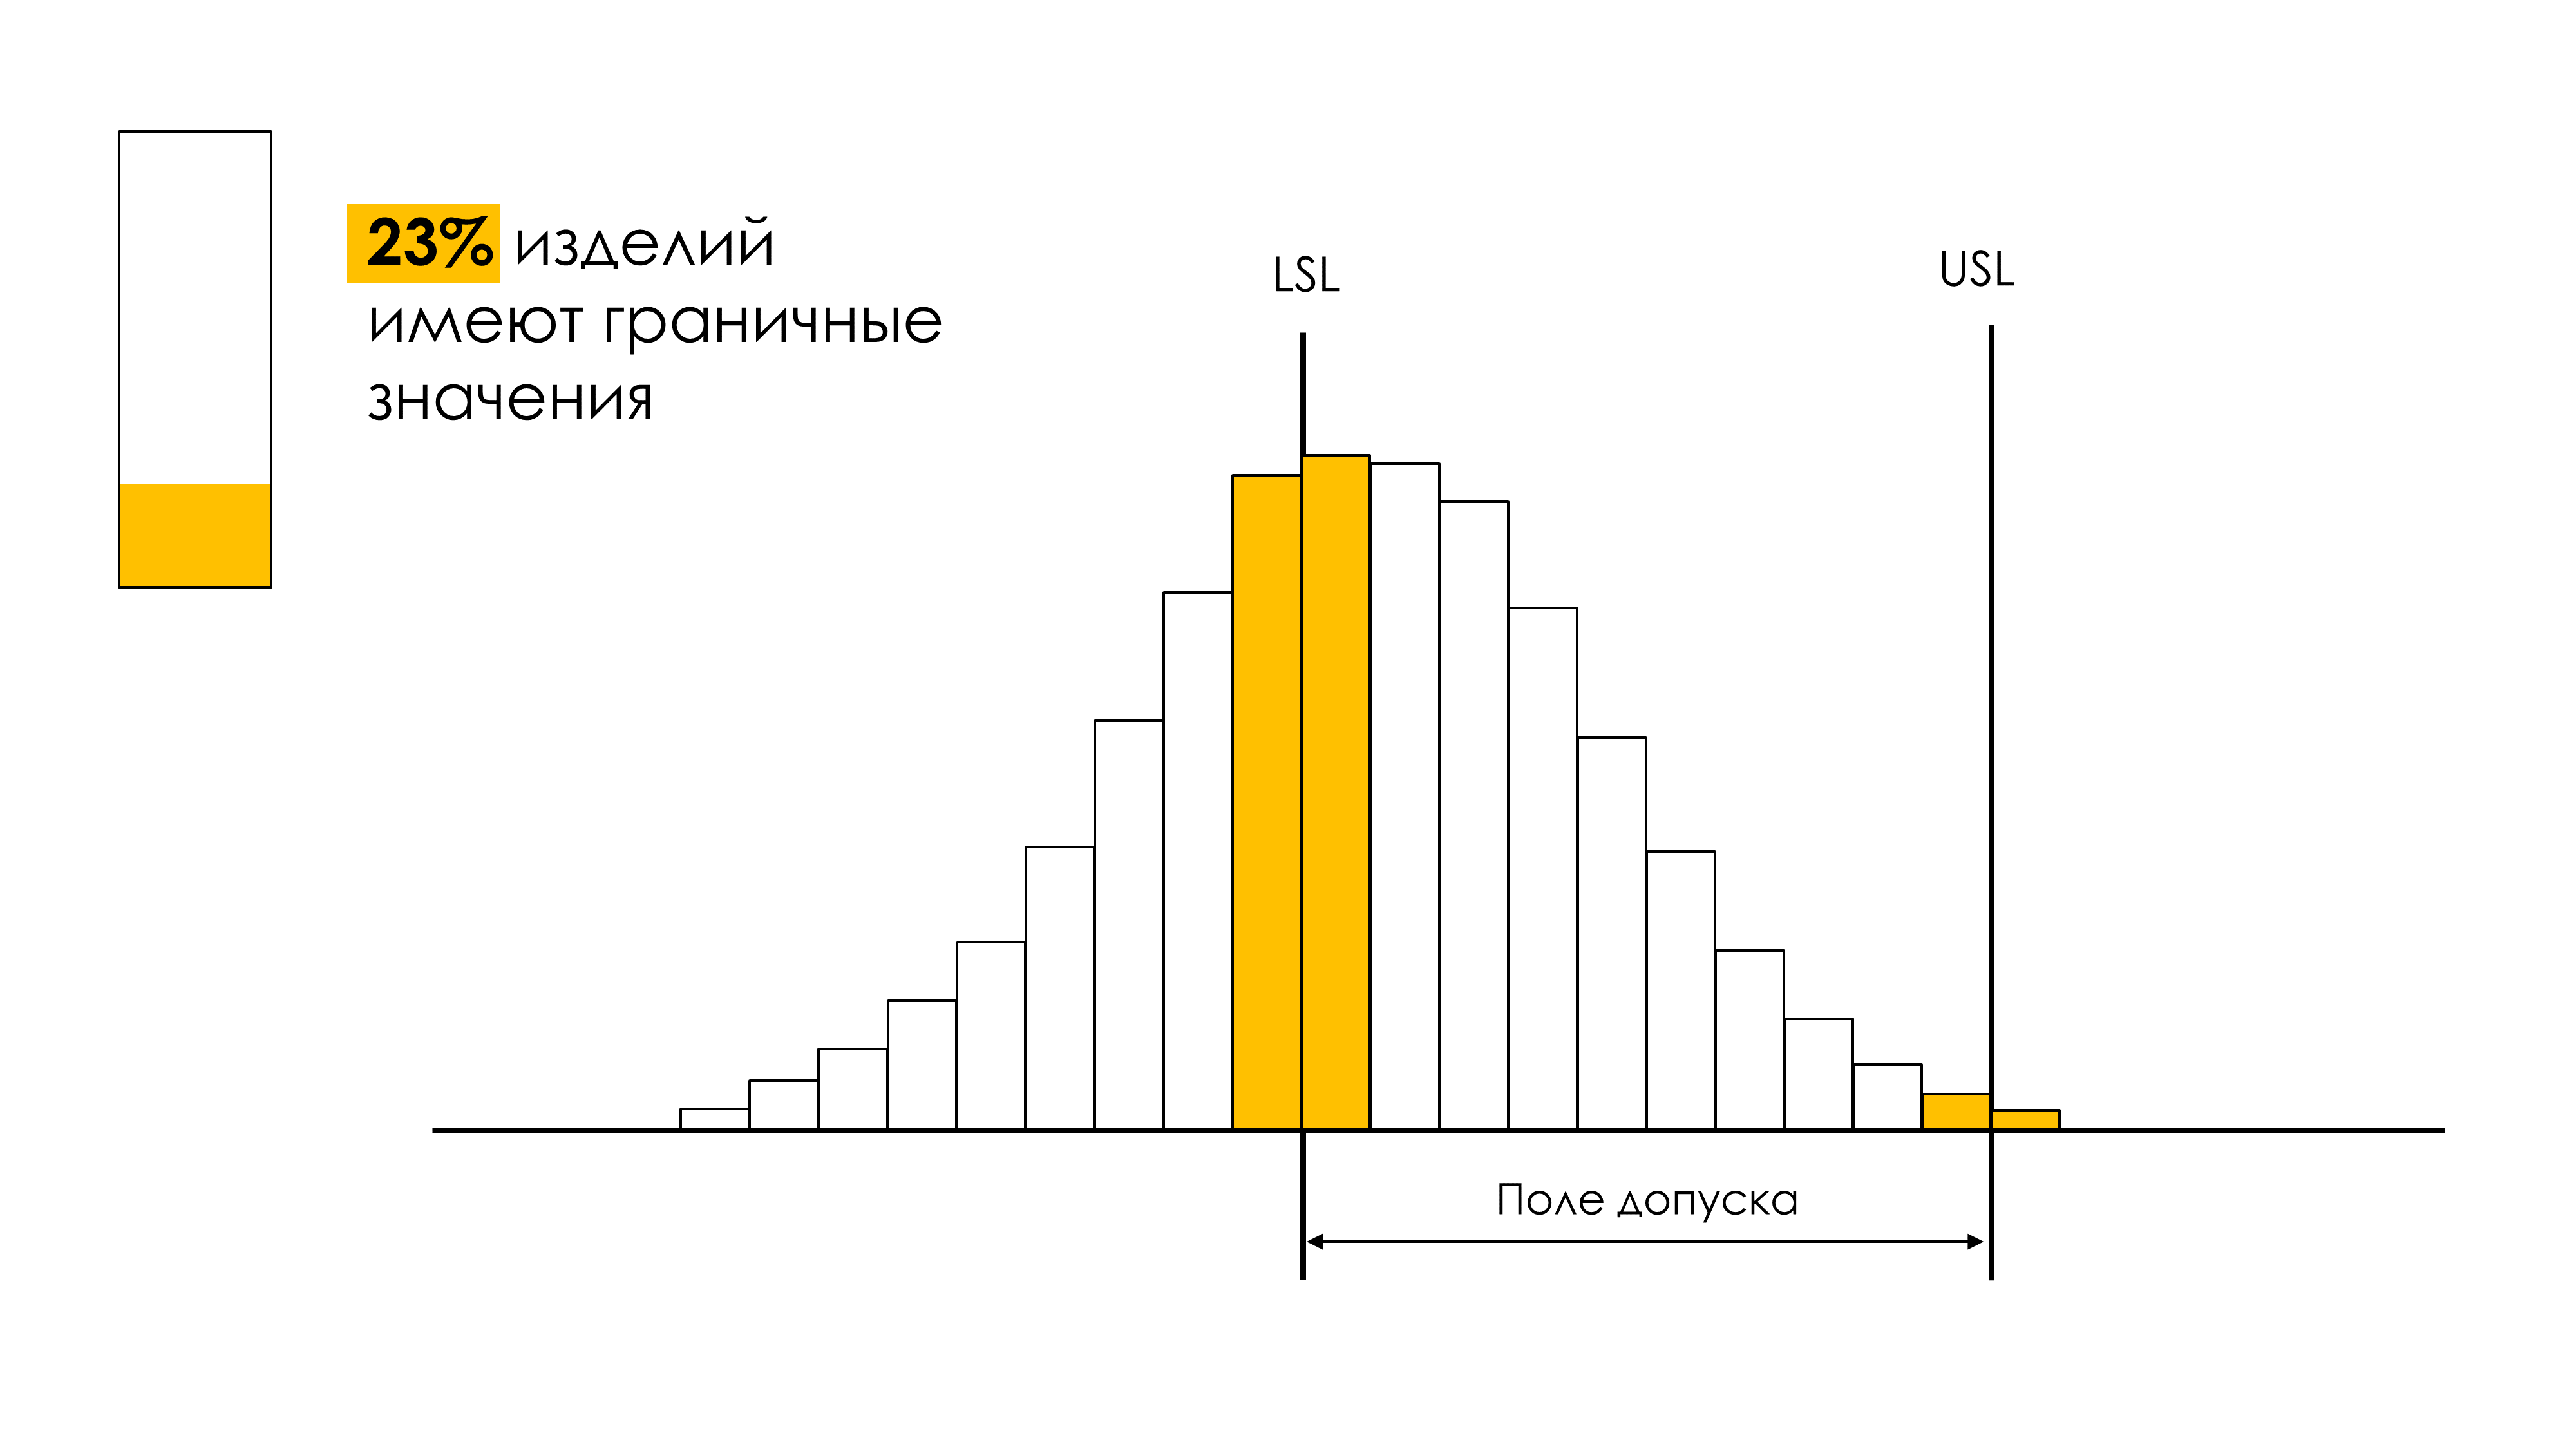
Figure 2. Boundary products (products at the boundaries of the tolerance zone) of a process operating wider than the tolerance zone - 2.
Legend: LSL and USL - lower and upper tolerance limits (specifications). The process is poorly centered in the tolerance field.
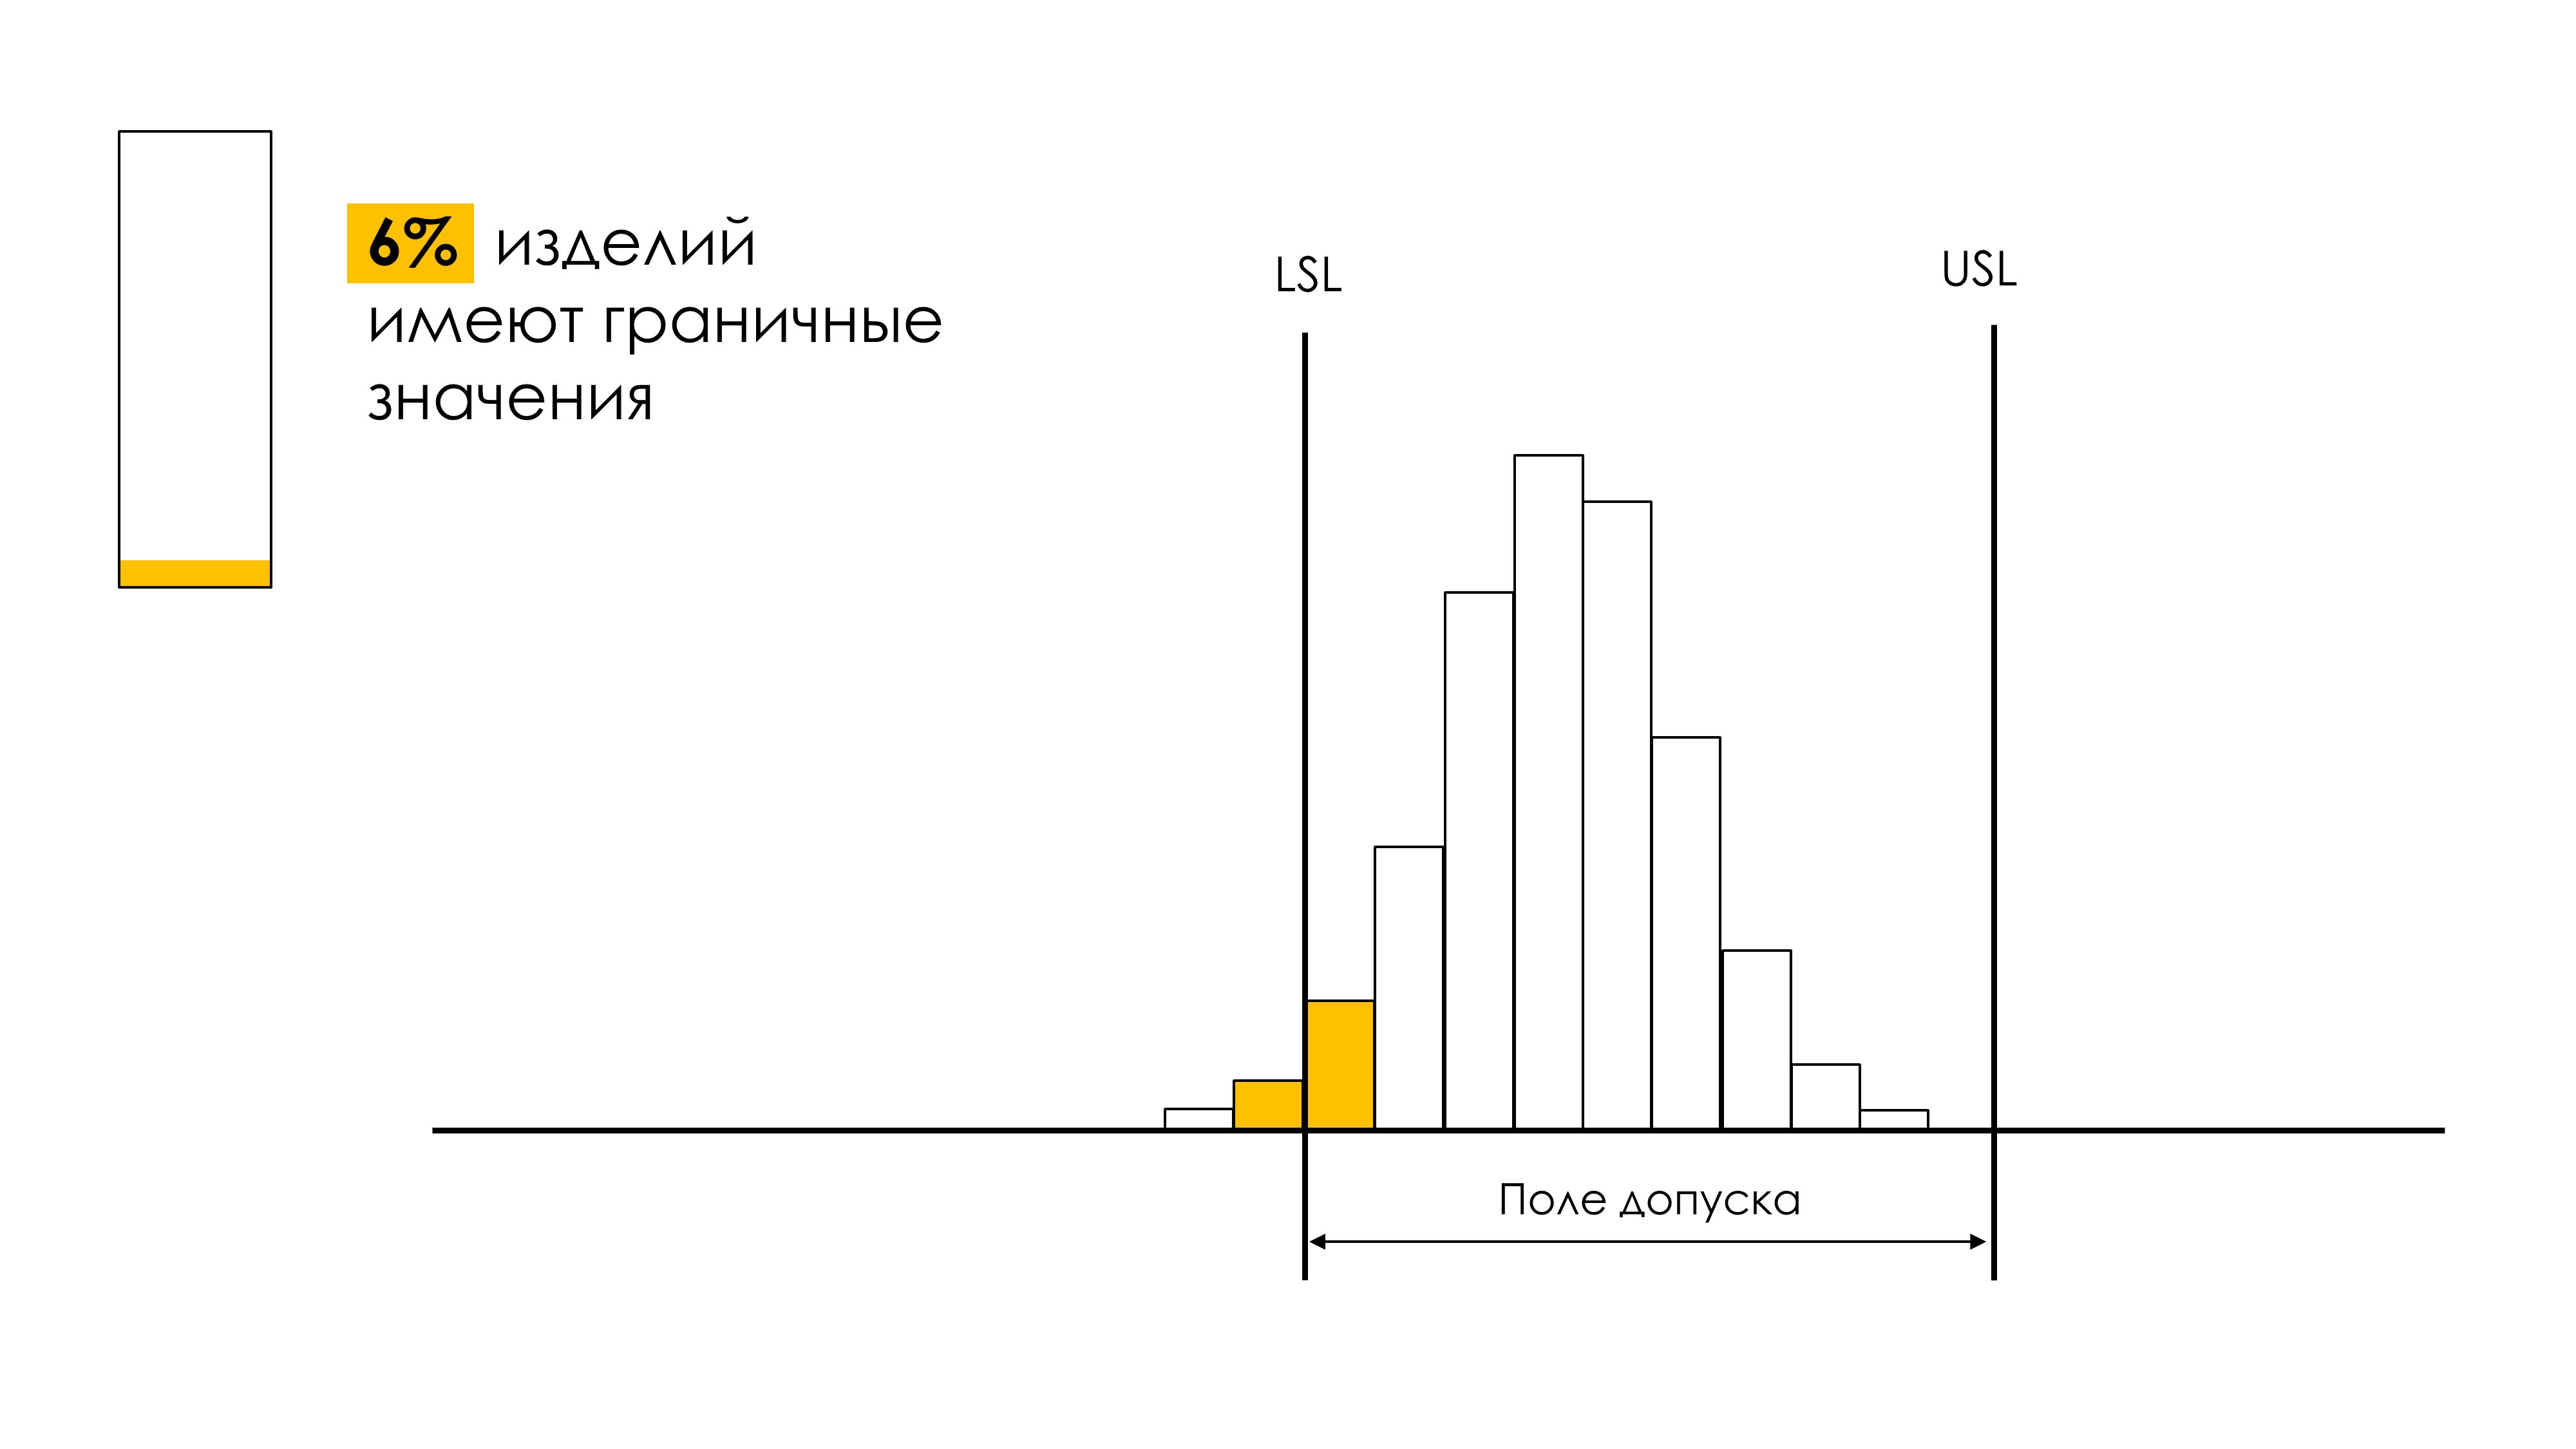
Figure 3. Boundary products (products at the boundaries of the tolerance field) of a process offset relative to the center of the tolerance field.
Legend: LSL and USL - lower and upper tolerance limits (specifications). The process works much narrower than in Fig. 1, with some offset from the centered position.
Donald Wheeler in his article [20] “Is the Part in Spec?” (Is the Part in Spec?) recommends making such a division into good and bad products along the compressed boundaries of the tolerance field (rejection field). So, if you need to be sure, that the product you ship is at least 85%, 96%, 99%, or 99.9% of specification, you will have to narrow the buyer's tolerance limits by the appropriate amount of probable error in your measurement system, thus obtaining a field rejections (see Figures 2-6 below).
“Given the trade-off between tighter specifications and higher probabilities, and given that the probabilities are minimal, I recommend using 96 percent production specifications in most situations.”
The losses of an enterprise whose processes exceed the tolerance limits are easy to assume. It will be necessary to decide what to do with the rejected products. These losses are supplemented by the work of inspectors for 100% control when separating products into those that meet specifications and those that do not. The controllers will definitely have to find time for this, and the company will have to pay for this work.
“Reliance on inspection is dangerous and costly.”
The best solution is to achieve the functioning of processes within such limits that the division into good and bad products is not required at all (see Figure 9, below).
“The only way to avoid supplying some nonconforming product is to avoid making the nonconforming product in the first place.”
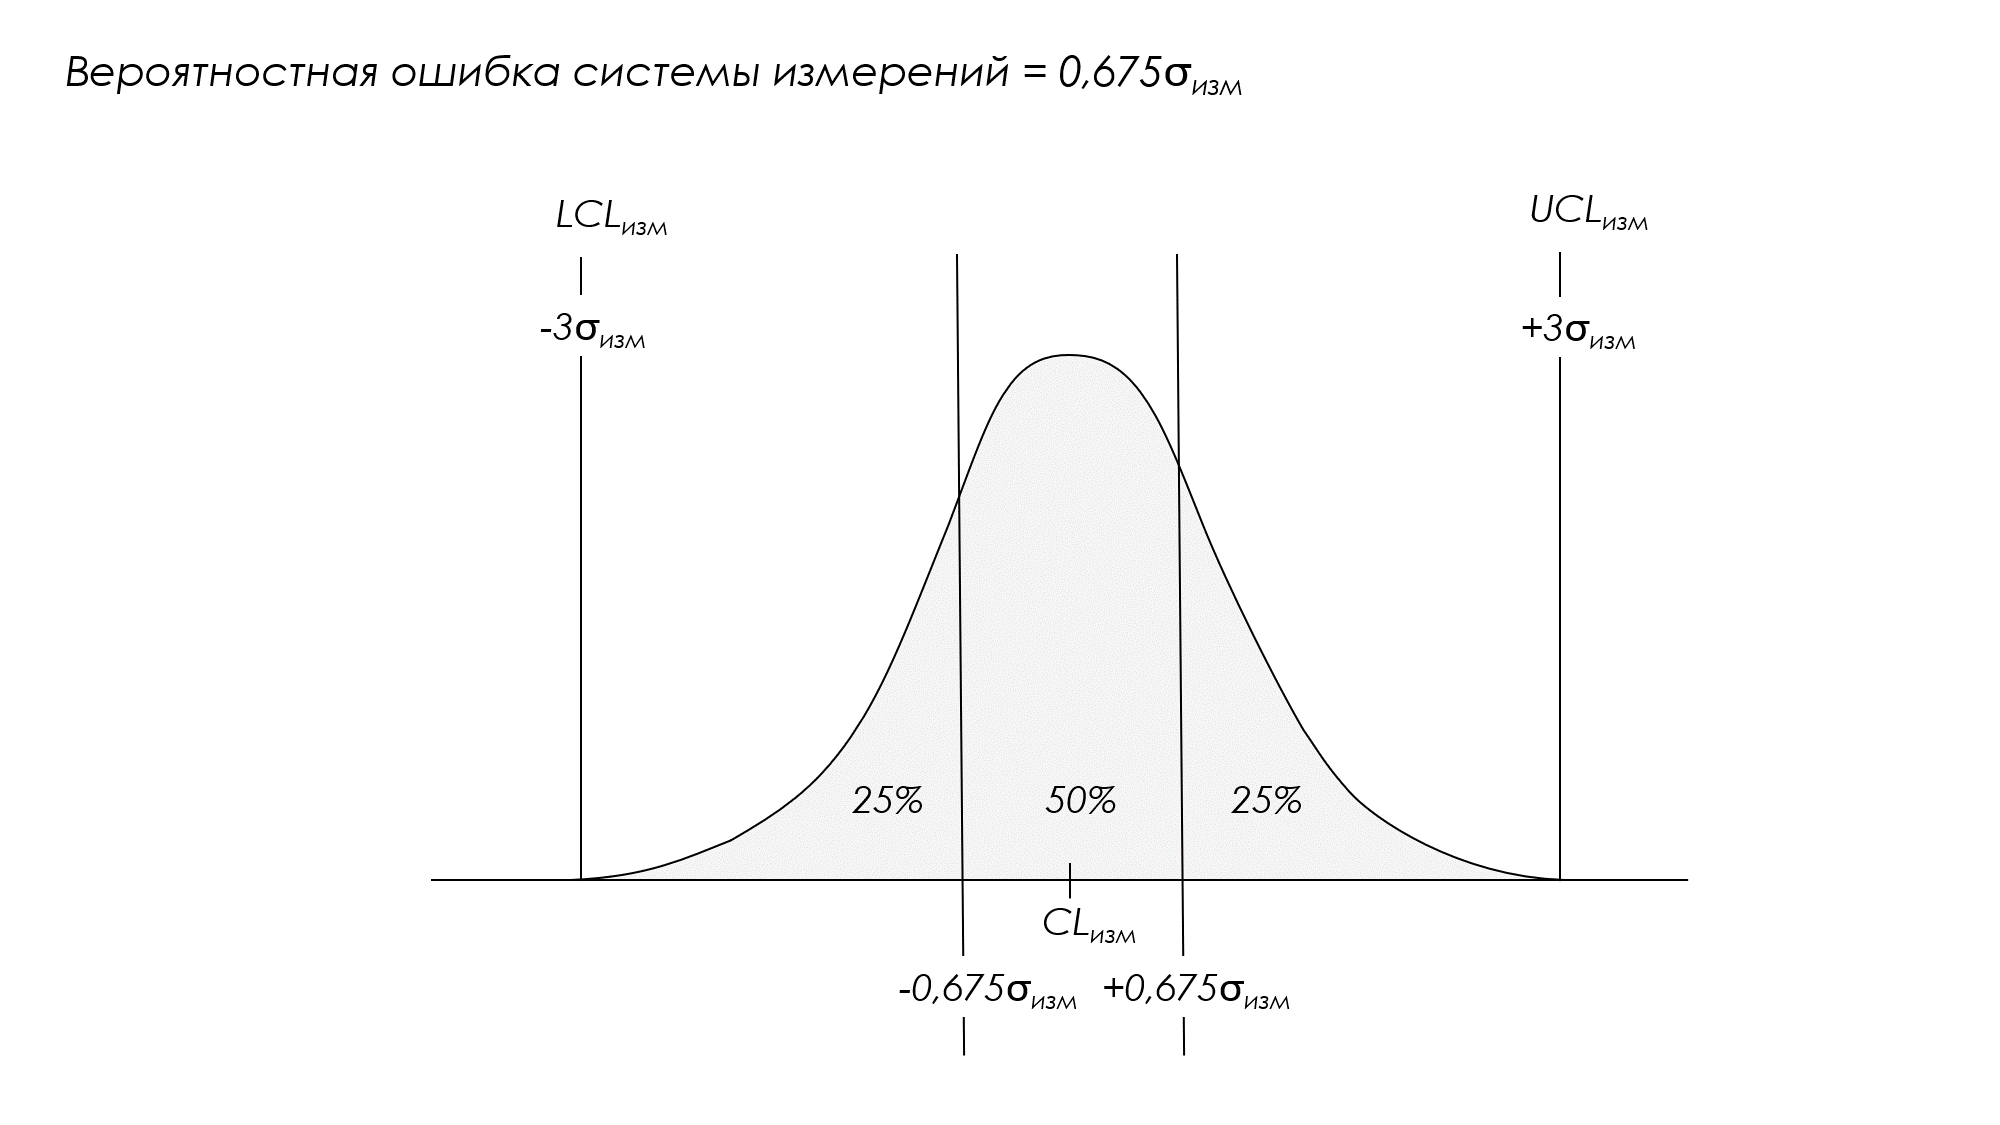
Figure 4. Probable error of a stable measurement system equal to 0.675σ
change
Legend: LCL and UCL - lower and upper limits of the process of multiple measurements of one standard; CL is the average of the unbiased measuring system, which must correspond to the standard.
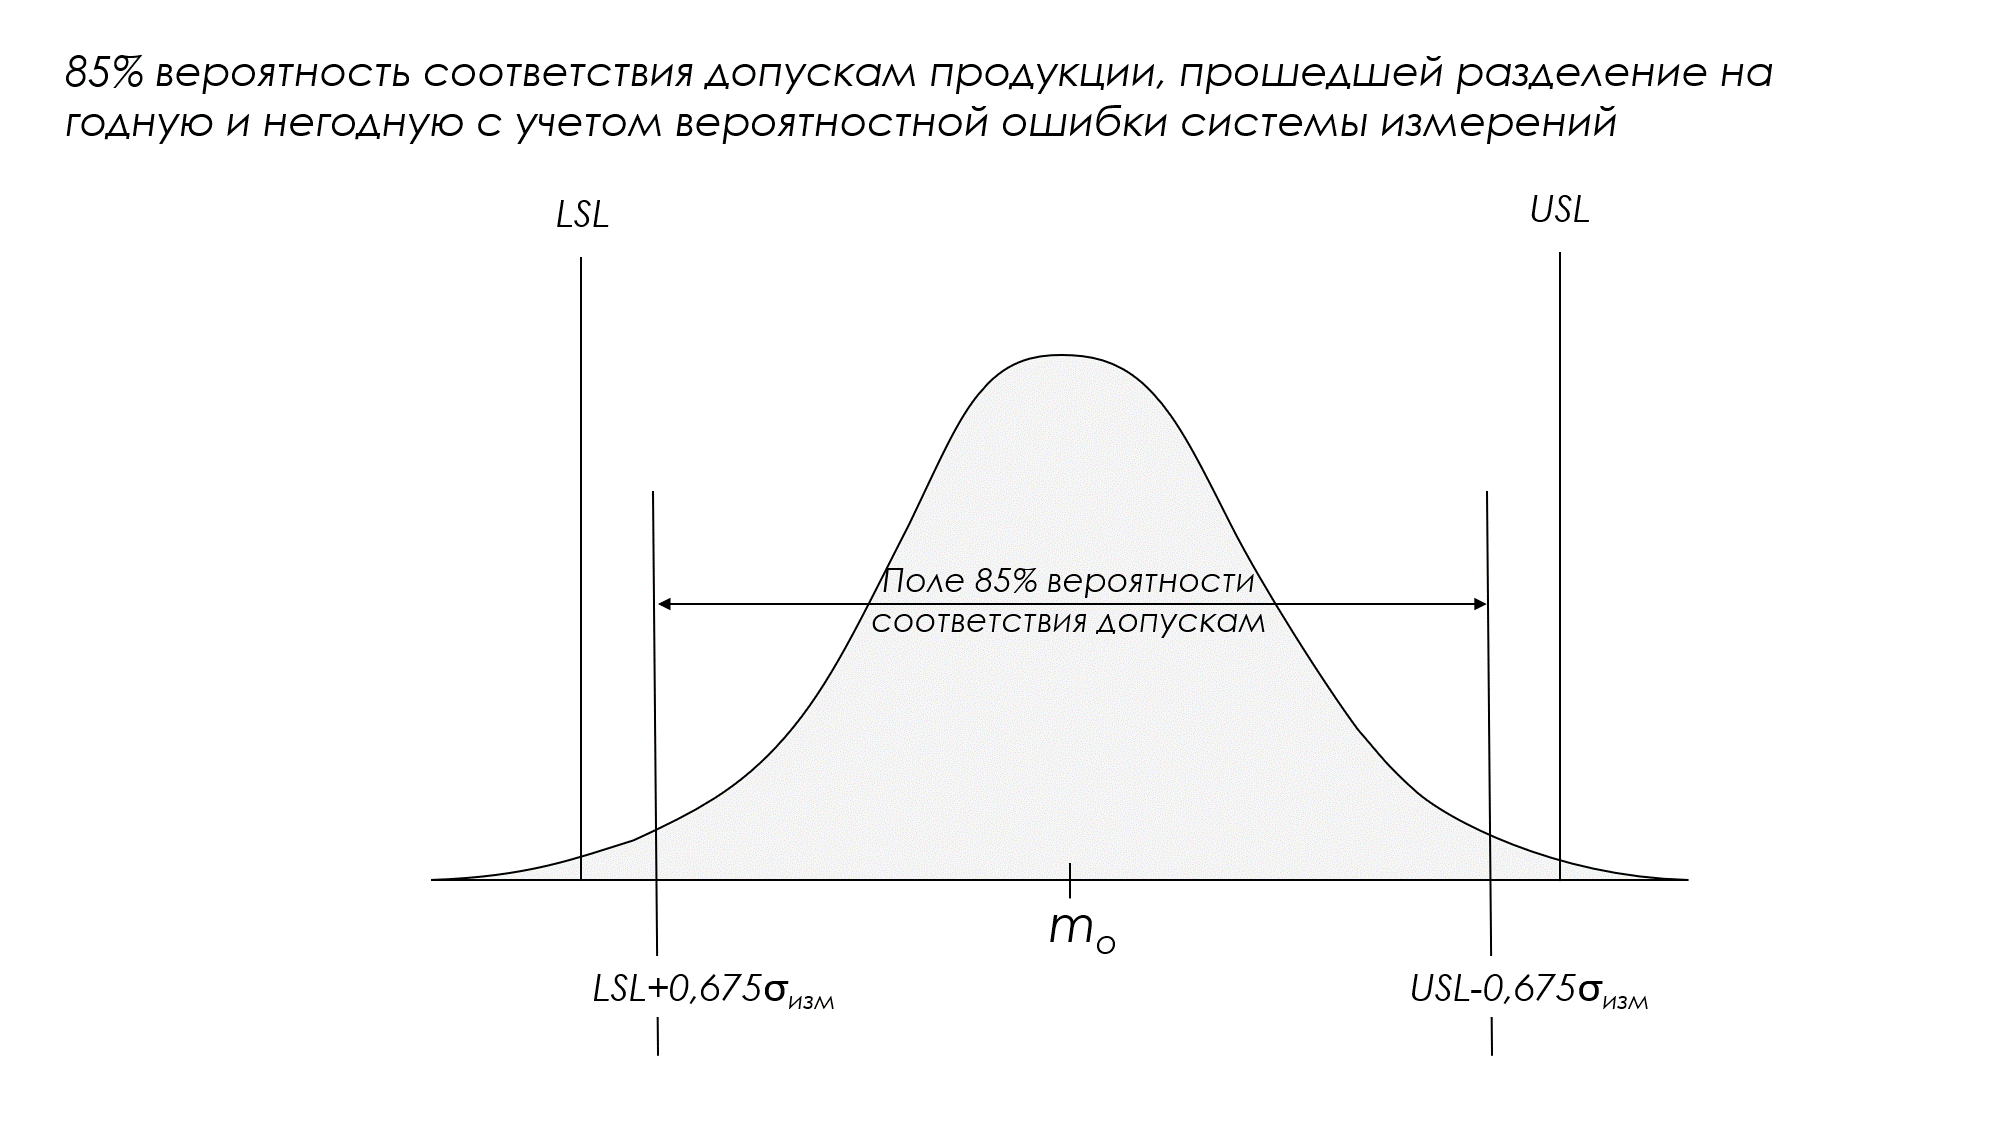
Figure 5. Ensuring an 85% probability of compliance with the tolerances of products that have been divided into passable and unsuitable, taking into account the two-way narrowing of the tolerance limits for one probable error (probable error) of the measurement system.
Legend: LSL and USL - lower and upper limits of the tolerance field (specifications); m0 is the nominal value of the tolerance field.
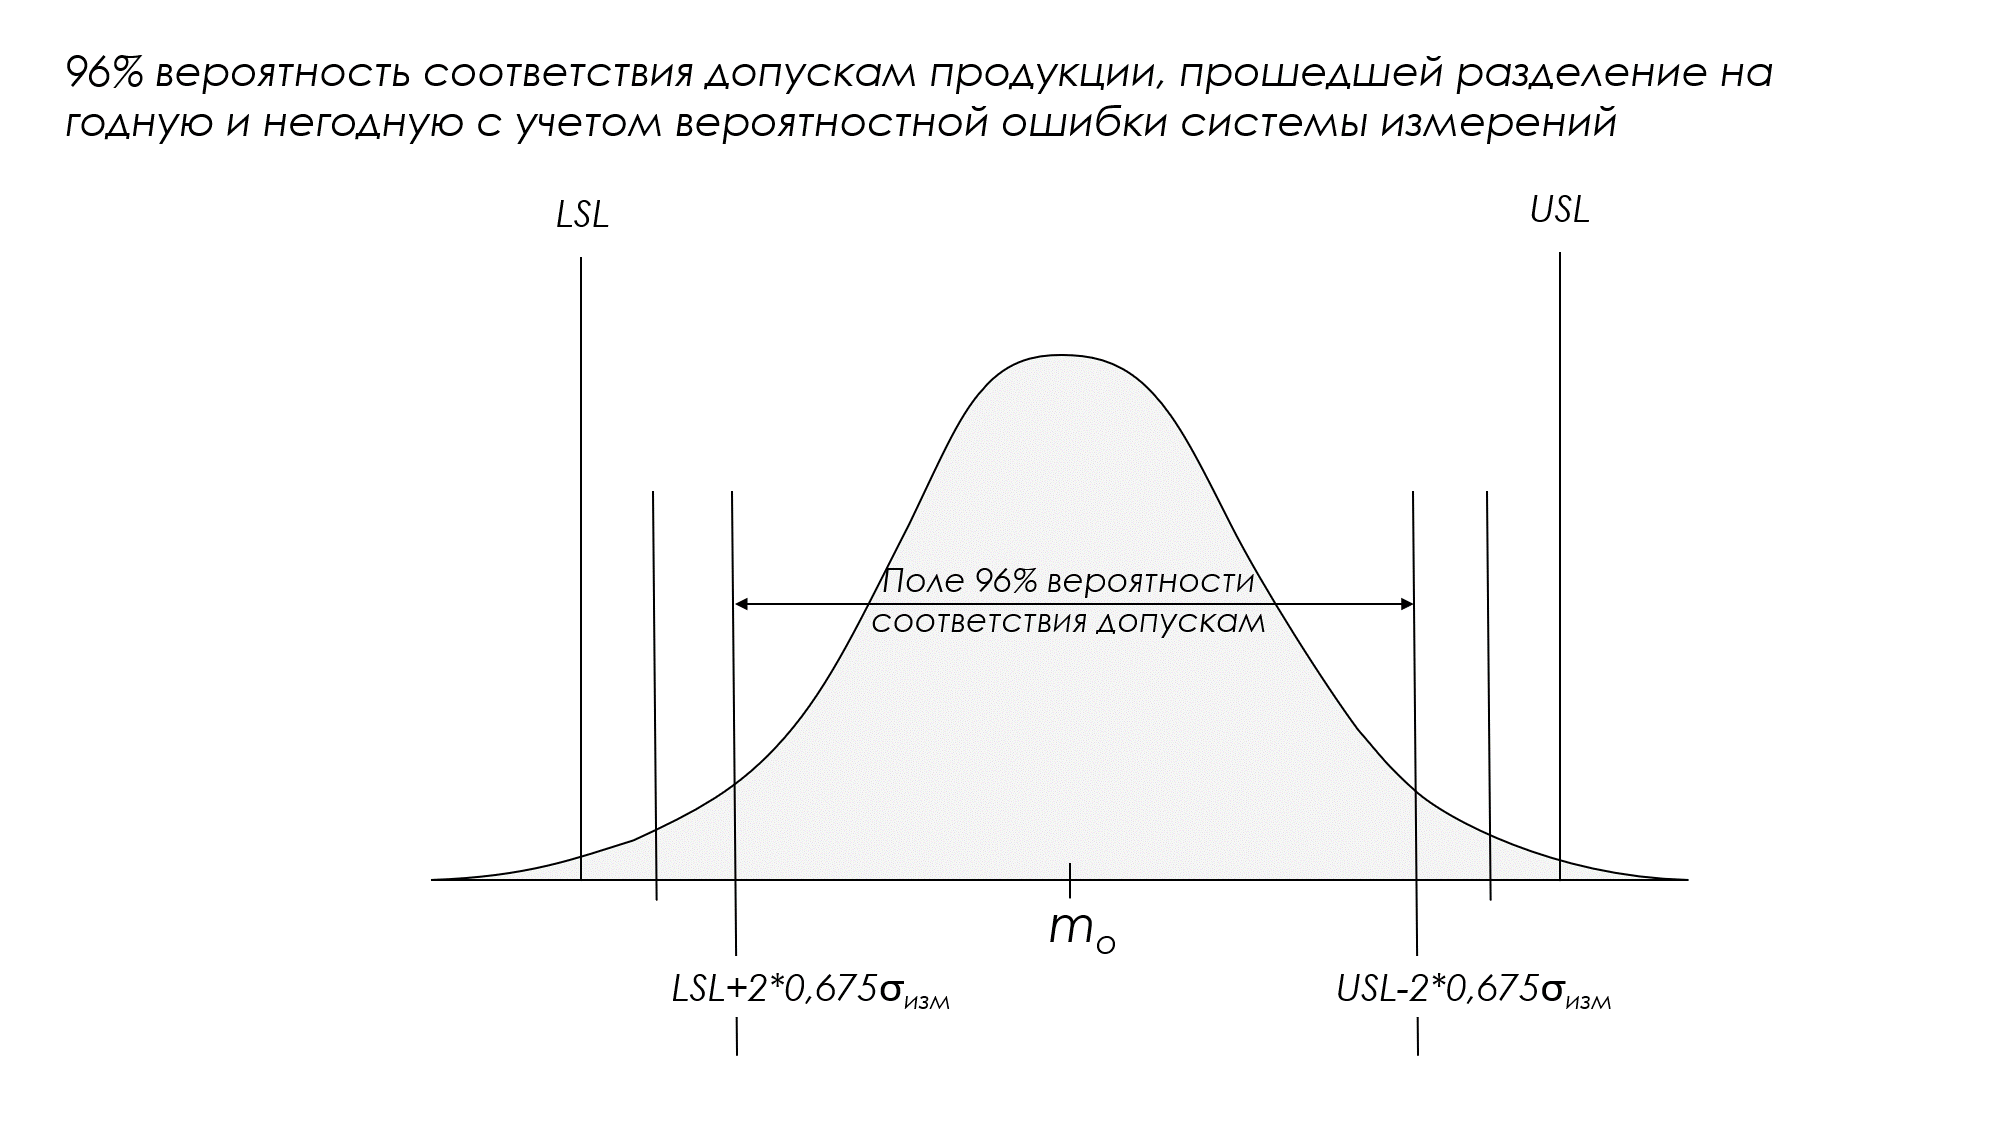
Figure 6. Ensuring a 96% probability of compliance with the tolerances of products that have been divided into passable and unsuitable, taking into account the bilateral narrowing of the tolerance limits for two probable errors (probable error) of the measurement system.
Legend: LSL and USL - lower and upper limits of the tolerance field (specifications); m0 is the nominal value of the tolerance field.
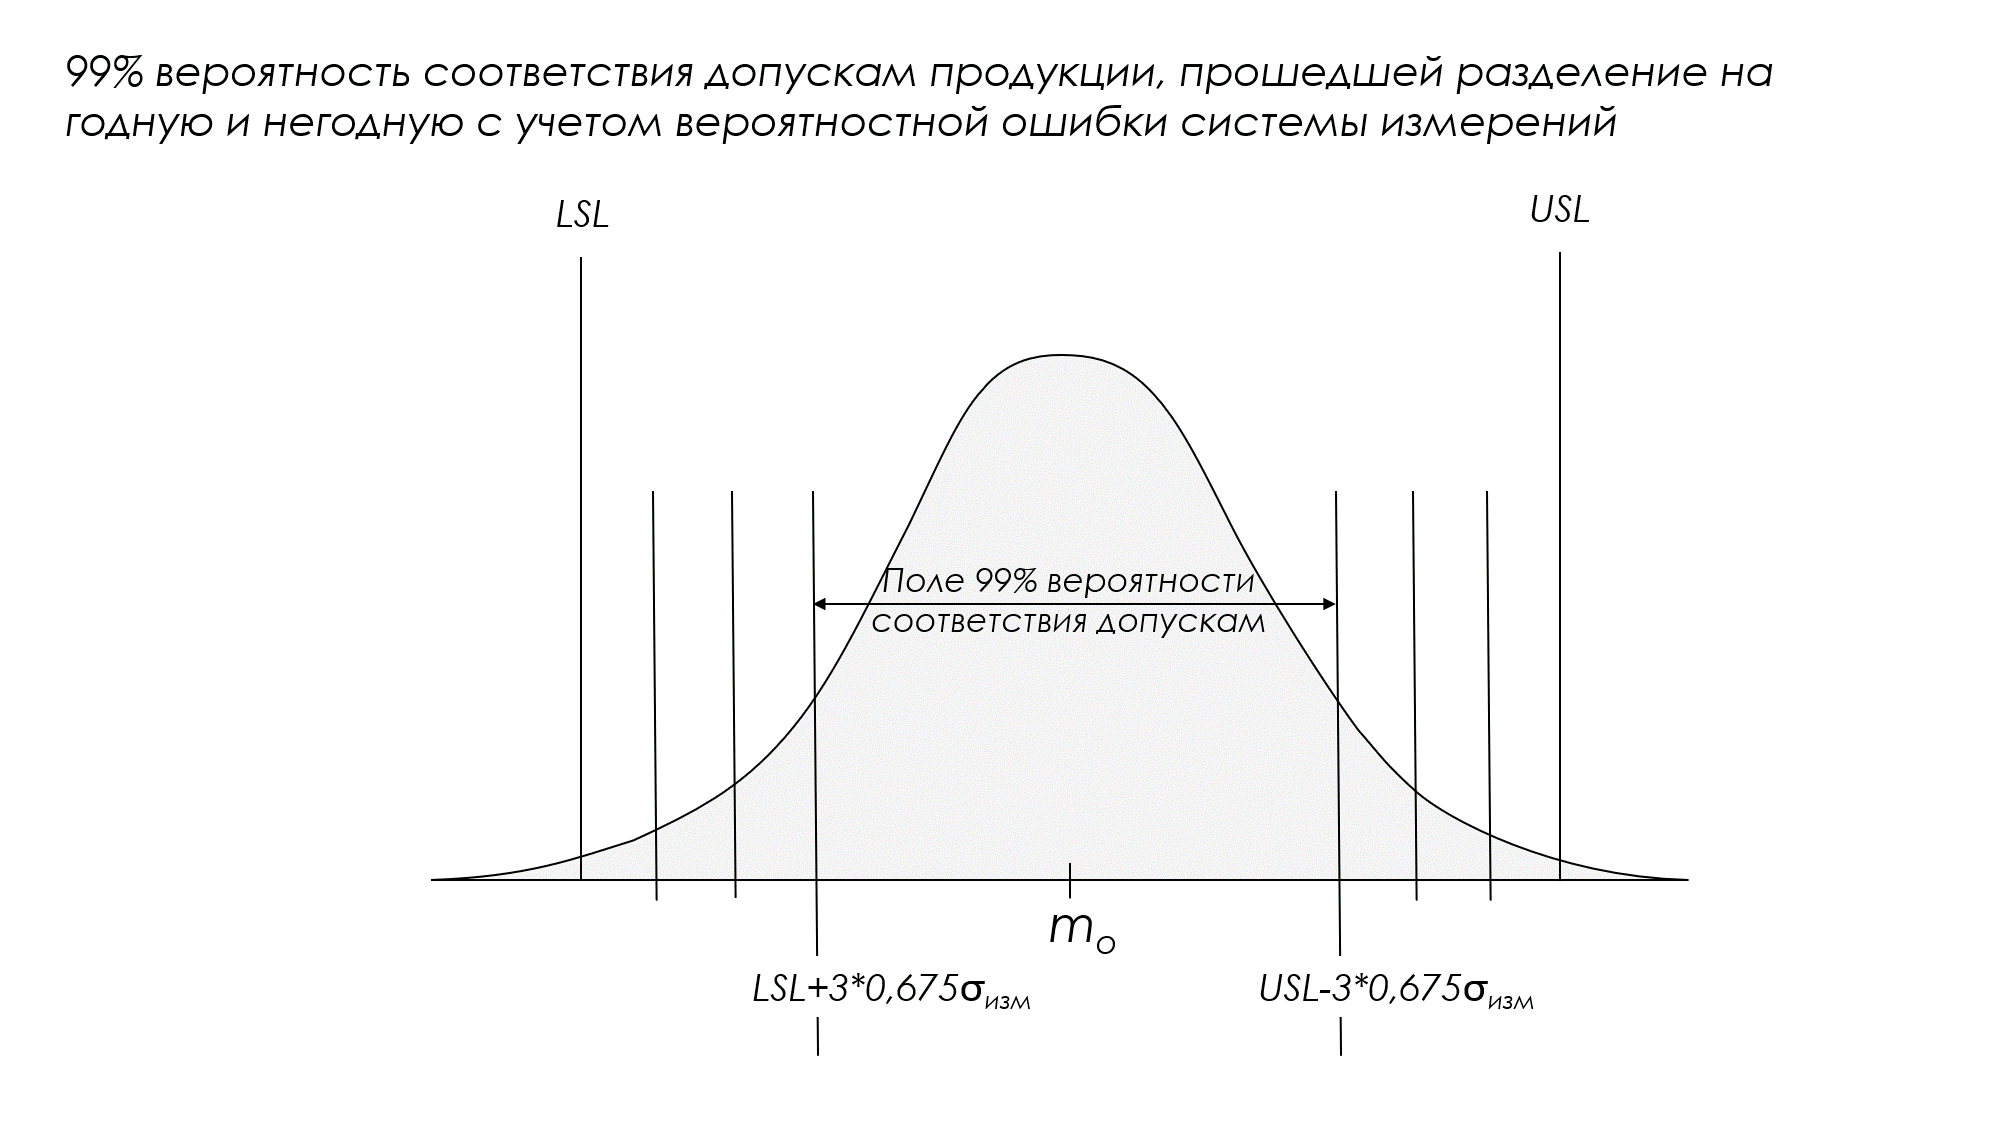
Figure 7. Ensuring a 99% probability of compliance with the tolerances of products that have been divided into passable and unsuitable, taking into account the two-way narrowing of the tolerance limits for three probable errors (probable error) of the measurement system.
Legend: LSL and USL - lower and upper limits of the tolerance field (specifications); m0 is the nominal value of the tolerance field.
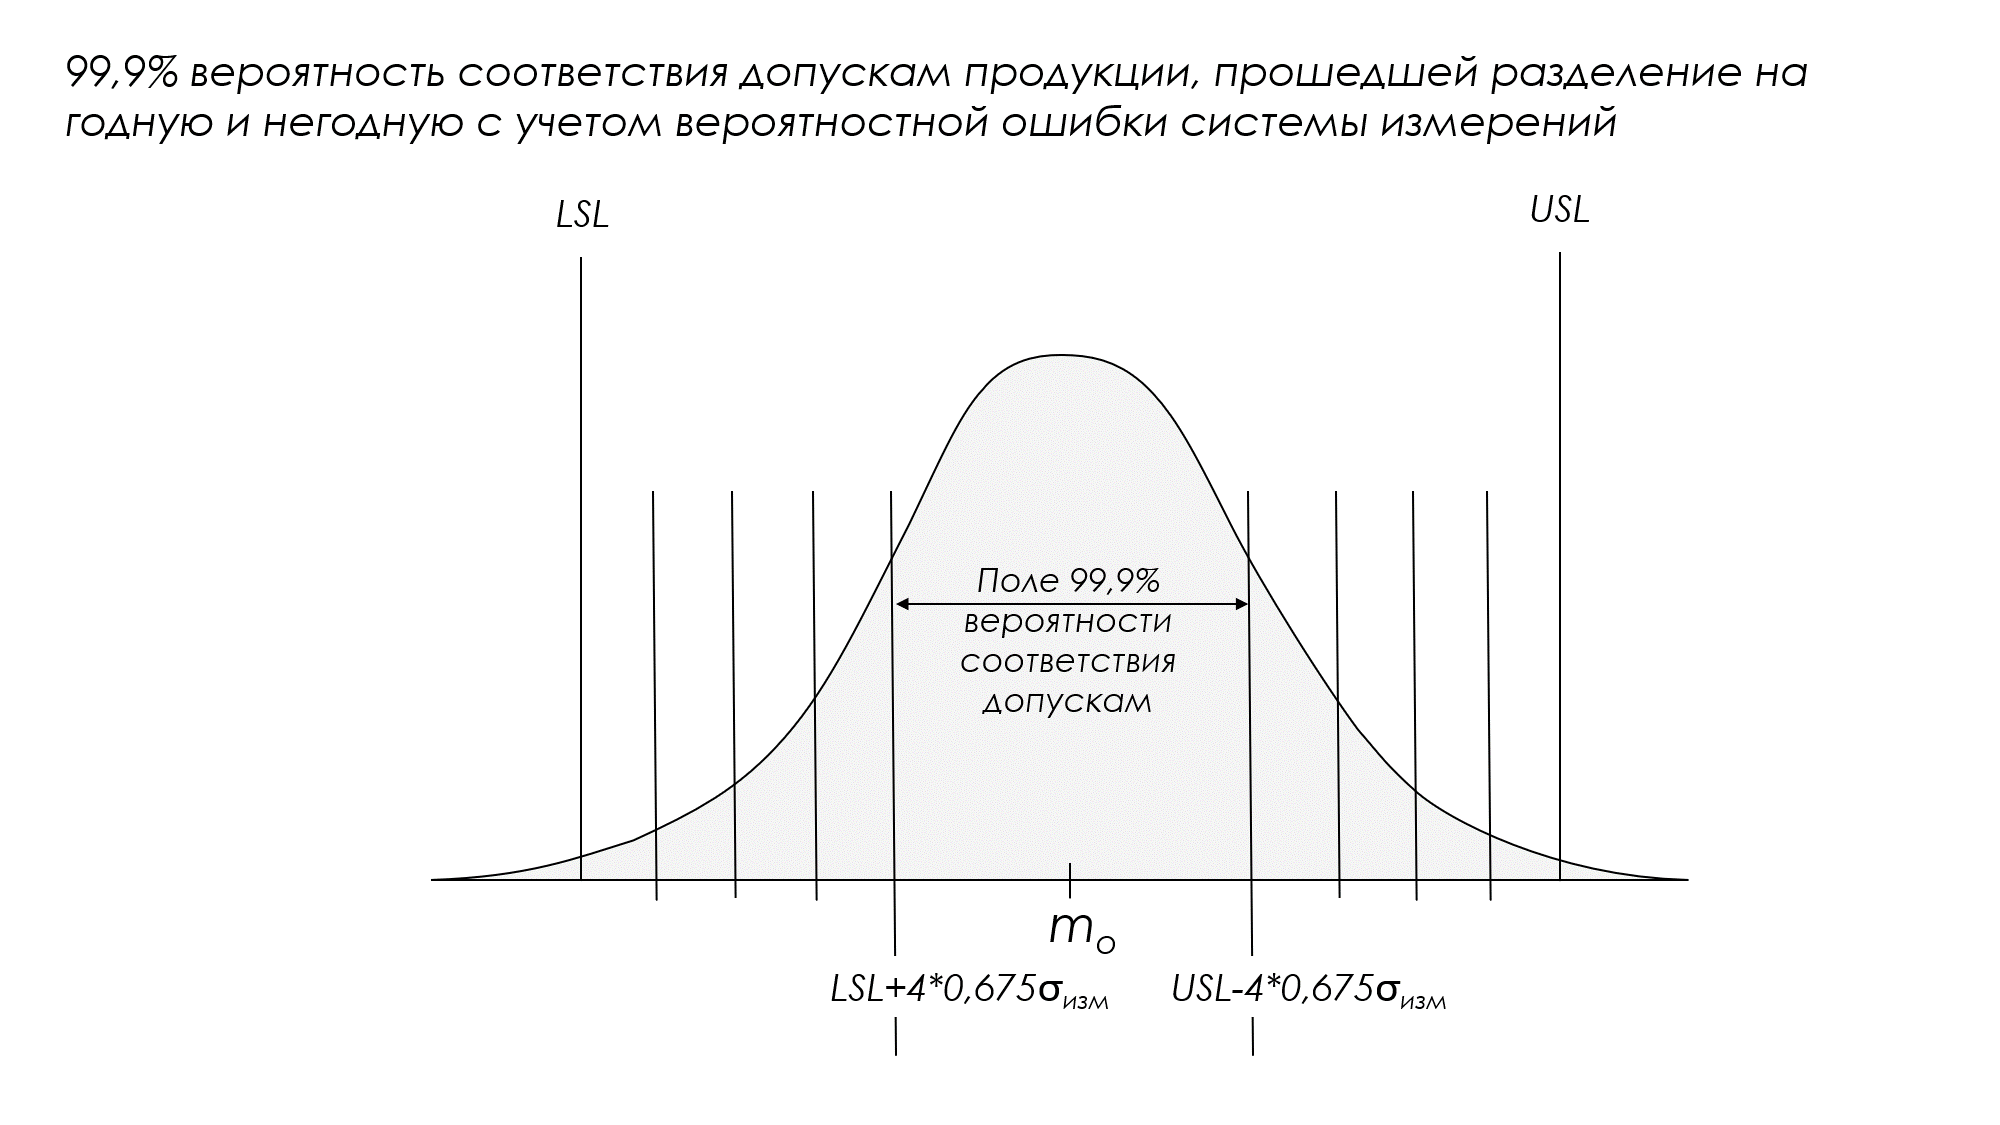
Figure 8. Ensuring a 99.9% probability of compliance with the tolerances of products that have been divided into passable and unsuitable, taking into account the two-way narrowing of the tolerance limits for four probable errors (probable errors) of the measurement system.
Legend: LSL and USL - lower and upper limits of the tolerance field (specifications); m0 is the nominal value of the tolerance field.
"It's best to avoid burning your toast. If you burn your toast, you'll have to figure out how to clean it up so you can eat some of it."
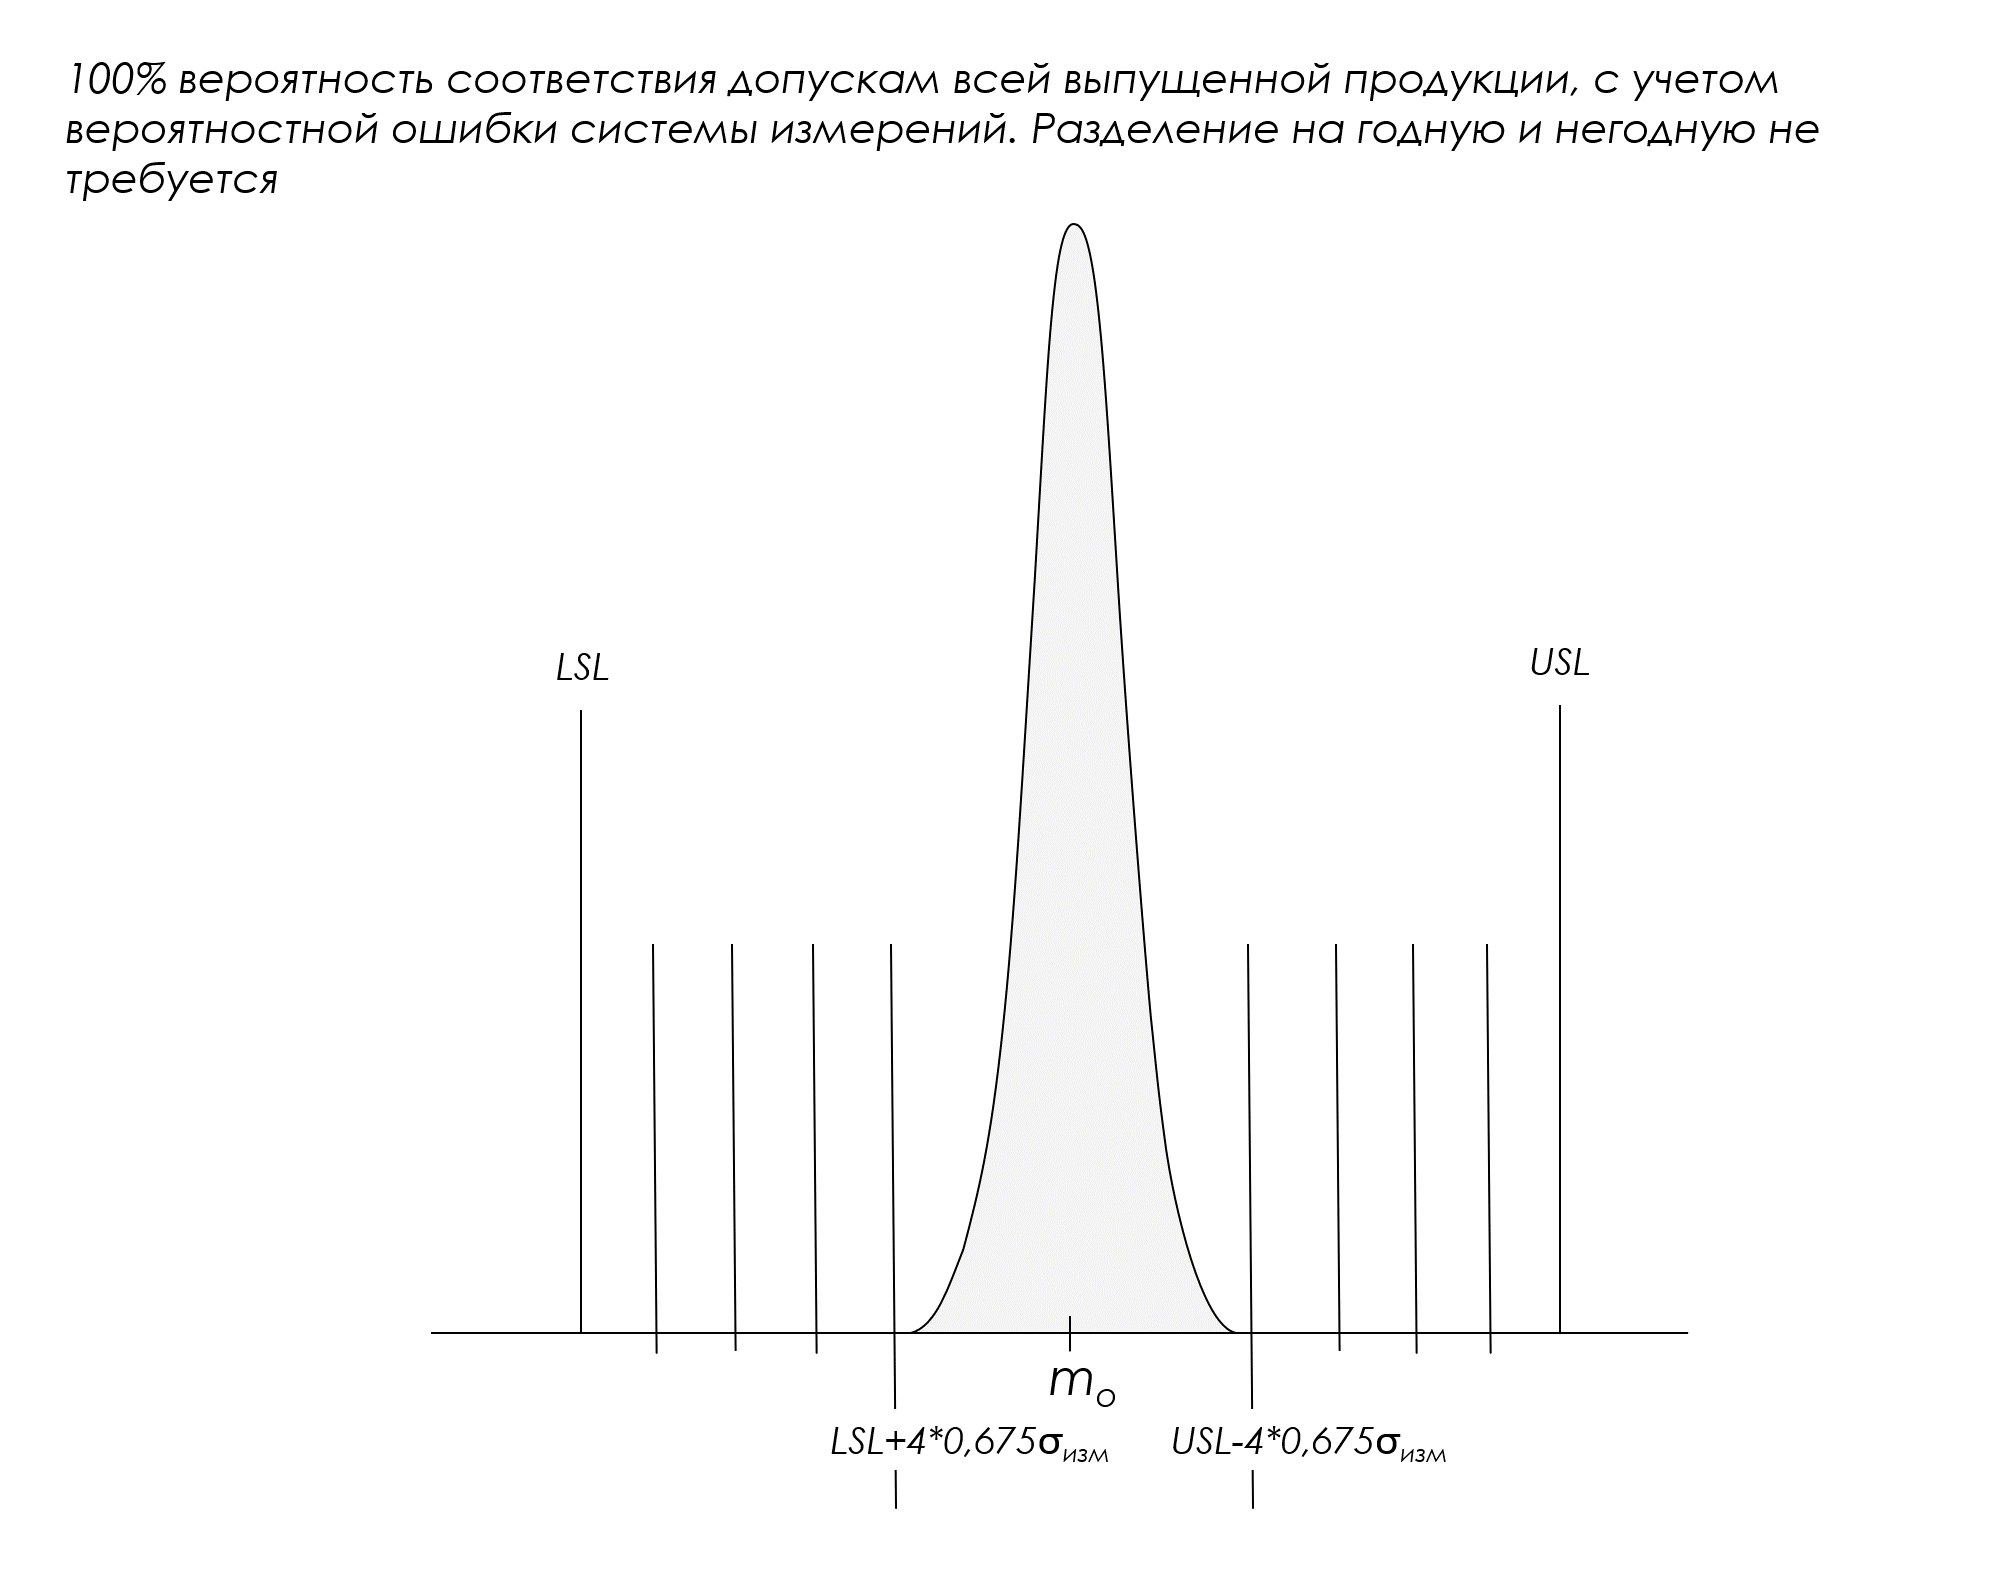
Figure 9. Ensuring a 100% probability of compliance with the tolerances of all manufactured products, taking into account the two-way narrowing of the tolerance limits for four probable errors of the measurement system. No division into good and bad products is required.
Legend: LSL and USL - lower and upper limits of the tolerance field (specifications); m0 is the nominal value of the tolerance field.
Are rejected products really defective?
For processes that operate wider than the compressed tolerance limits, after separating the products into passable and unsuitable with the selected probability of suitability, the next stage of testing the products rejected within the compressed tolerance limits will begin.
Next, you will have to decide whether the rejected products are actually defective, again with some probability? For example, you will have to check all rejected products that fall into the following areas:
and USL+/-4×0.675σ change .
Repeated measurements of the same unit of production with recording of their average value serve as a tool for reducing the error of the measurement system σ change (n) and, as a consequence, the probable error of measurements is 0.675σ change (n).
So, for example, if you take (n) repeated measurements and record the average value, then the probable error of such a measurement system will be:
0.675σ change (n)= 0.675σ change /√n
After which it will be necessary, based on the average value (n) of measurements of each unit, to make a decision about its suitability relative to a new rejection field, namely, tolerance limits narrowed, for example, to four probabilistic errors of the measurement system with (n) repetitions of 0.675*σ change (n) for at least a 99.9% probability of meeting the tolerance of previously rejected products:
LSL+4*0.675*σ change /√n and USL-4*0.675*σ change /√n
It is easy to understand that, for example, 4 repeated measurements for each boundary measurement will improve (reduce the probable error (probable error)) of the measurement system by a factor of two:
√n=√4=2
This can return to serviceable some of the products previously rejected due to tight tolerance limits. And most likely, you will have to hire an army of controllers for this job.
I repeat. The best solution is to improve the functioning of processes to such an extent that division into good and bad products is not required at all (Figure 9.)
“You will either need to work on improving the measurement system or work on improving the manufacturing process.
Upgrading the measurement system will result in increased overhead costs. It won't make the product better. This will not eliminate the need for an inspection. This will simply reduce your productivity by increasing the costs associated with searching for burnt toast.
Improving the production process will reduce both excess production costs and excess use costs. Moreover, as has been proven time and time again, these process improvements can usually be achieved without capital expenditure and without the need to improve an imperfect measurement system. It's always better to learn to stop burning toast than to be a world-class toast scraper.
This is why excessive interest in measurement quality is counterproductive. Imperfect (but stable) measurement systems can be used to significantly improve the quality and consistency of the manufacturing process. These improvements can eliminate the need for 100 percent inspection while reducing other excess costs for both the manufacturer and the customer.
However, as we have already seen, imperfect measurements will not do a good job of grading the product. If we focus on improving the measurement system so we can grade the product to specifications (tolerances), our effort, time and resources will be spent increasing our overhead rather than reducing our costs.”
The software we developed, “Shewhart control charts PRO-Analyst +AI (for Windows, Mac, Linux)”, implements the function converting the tolerance field (customer tolerance field) into production narrowed and shifted tolerance (acceptance tolerance) .
If your measurement system is in a statistically stable state (assessed using an XmR-chart of 25-30 test-retest measurements of the same standard (reference)), then the histogram graph of individual values together with the process control limits can display the production limits tolerances (specifications) obtained taking into account the error and bias of the measuring system for user-selected minimum probabilities (85%, 96%, 99% and 99.9%) of compliance with product tolerances. This function is used when dividing products into good and bad, taking into account the corresponding narrowing of the established limits of customer tolerances from one to four probable errors of the measurement system on each side, respectively.
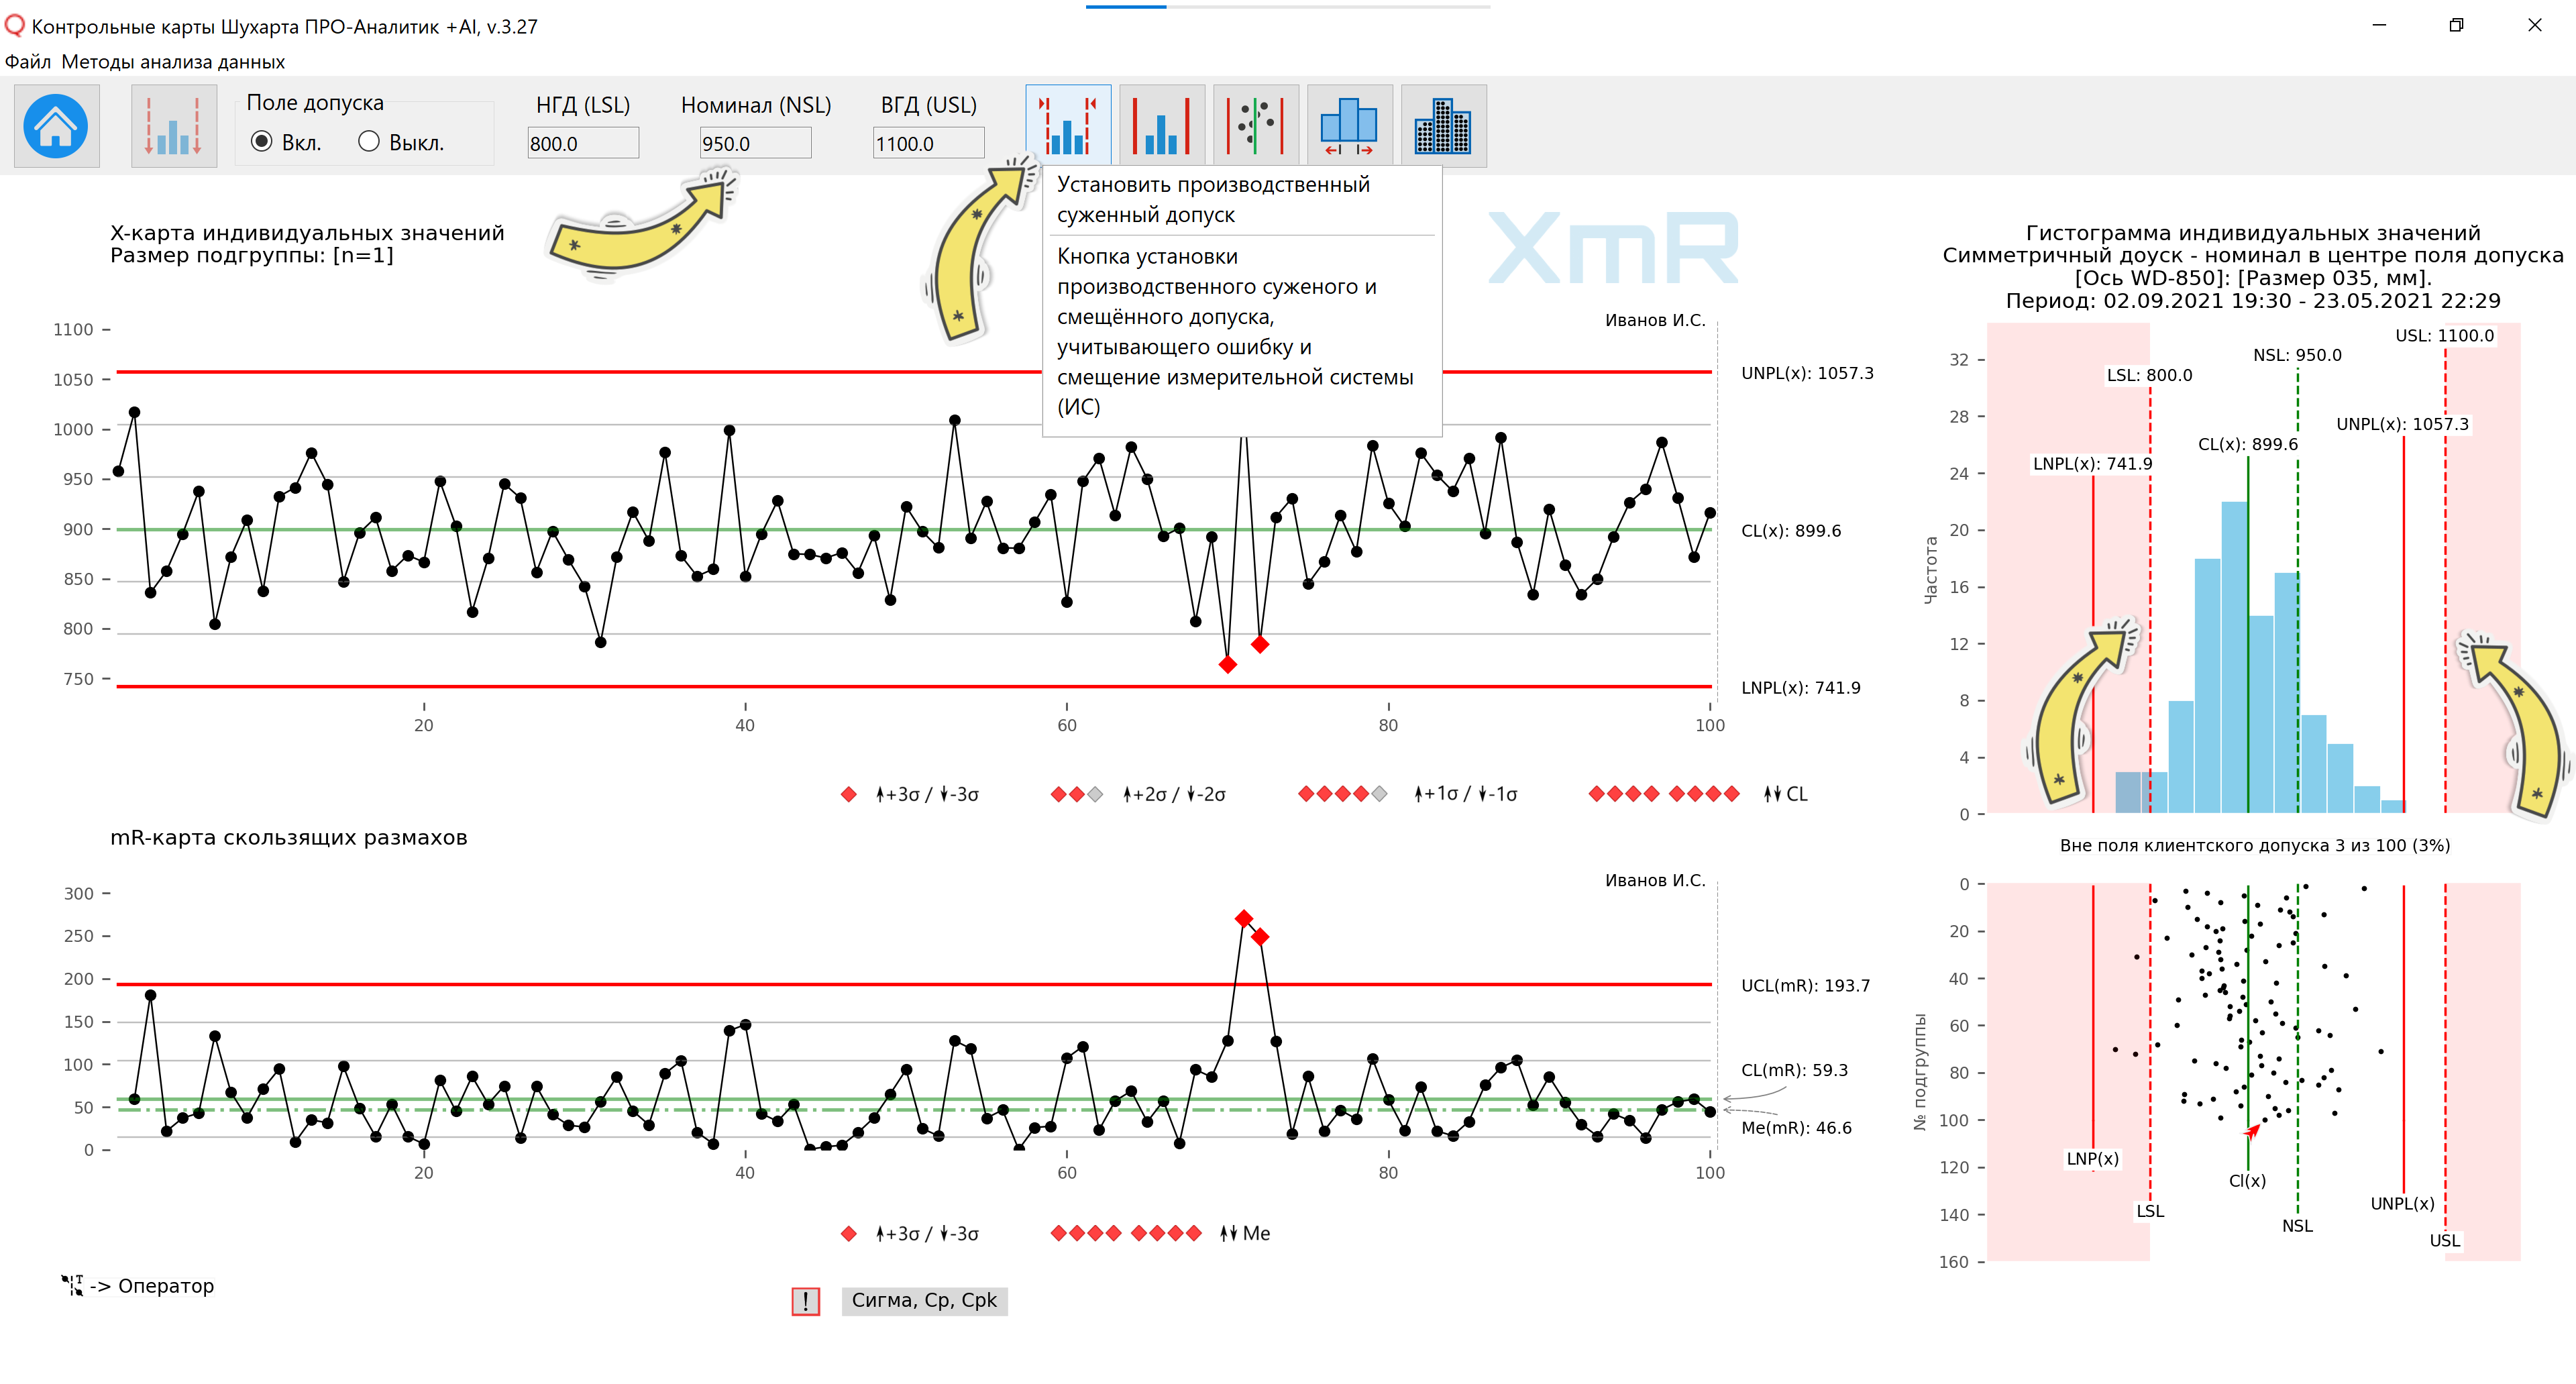
Figure 10. The distribution histogram and scatter plot display the customer tolerance (LSL, NSL, USL), before applying the narrowed and shifted manufacturing tolerance field. The drawing was prepared using our developed “Shewhart control charts PRO-Analyst +AI (for Windows, Mac, Linux)” .
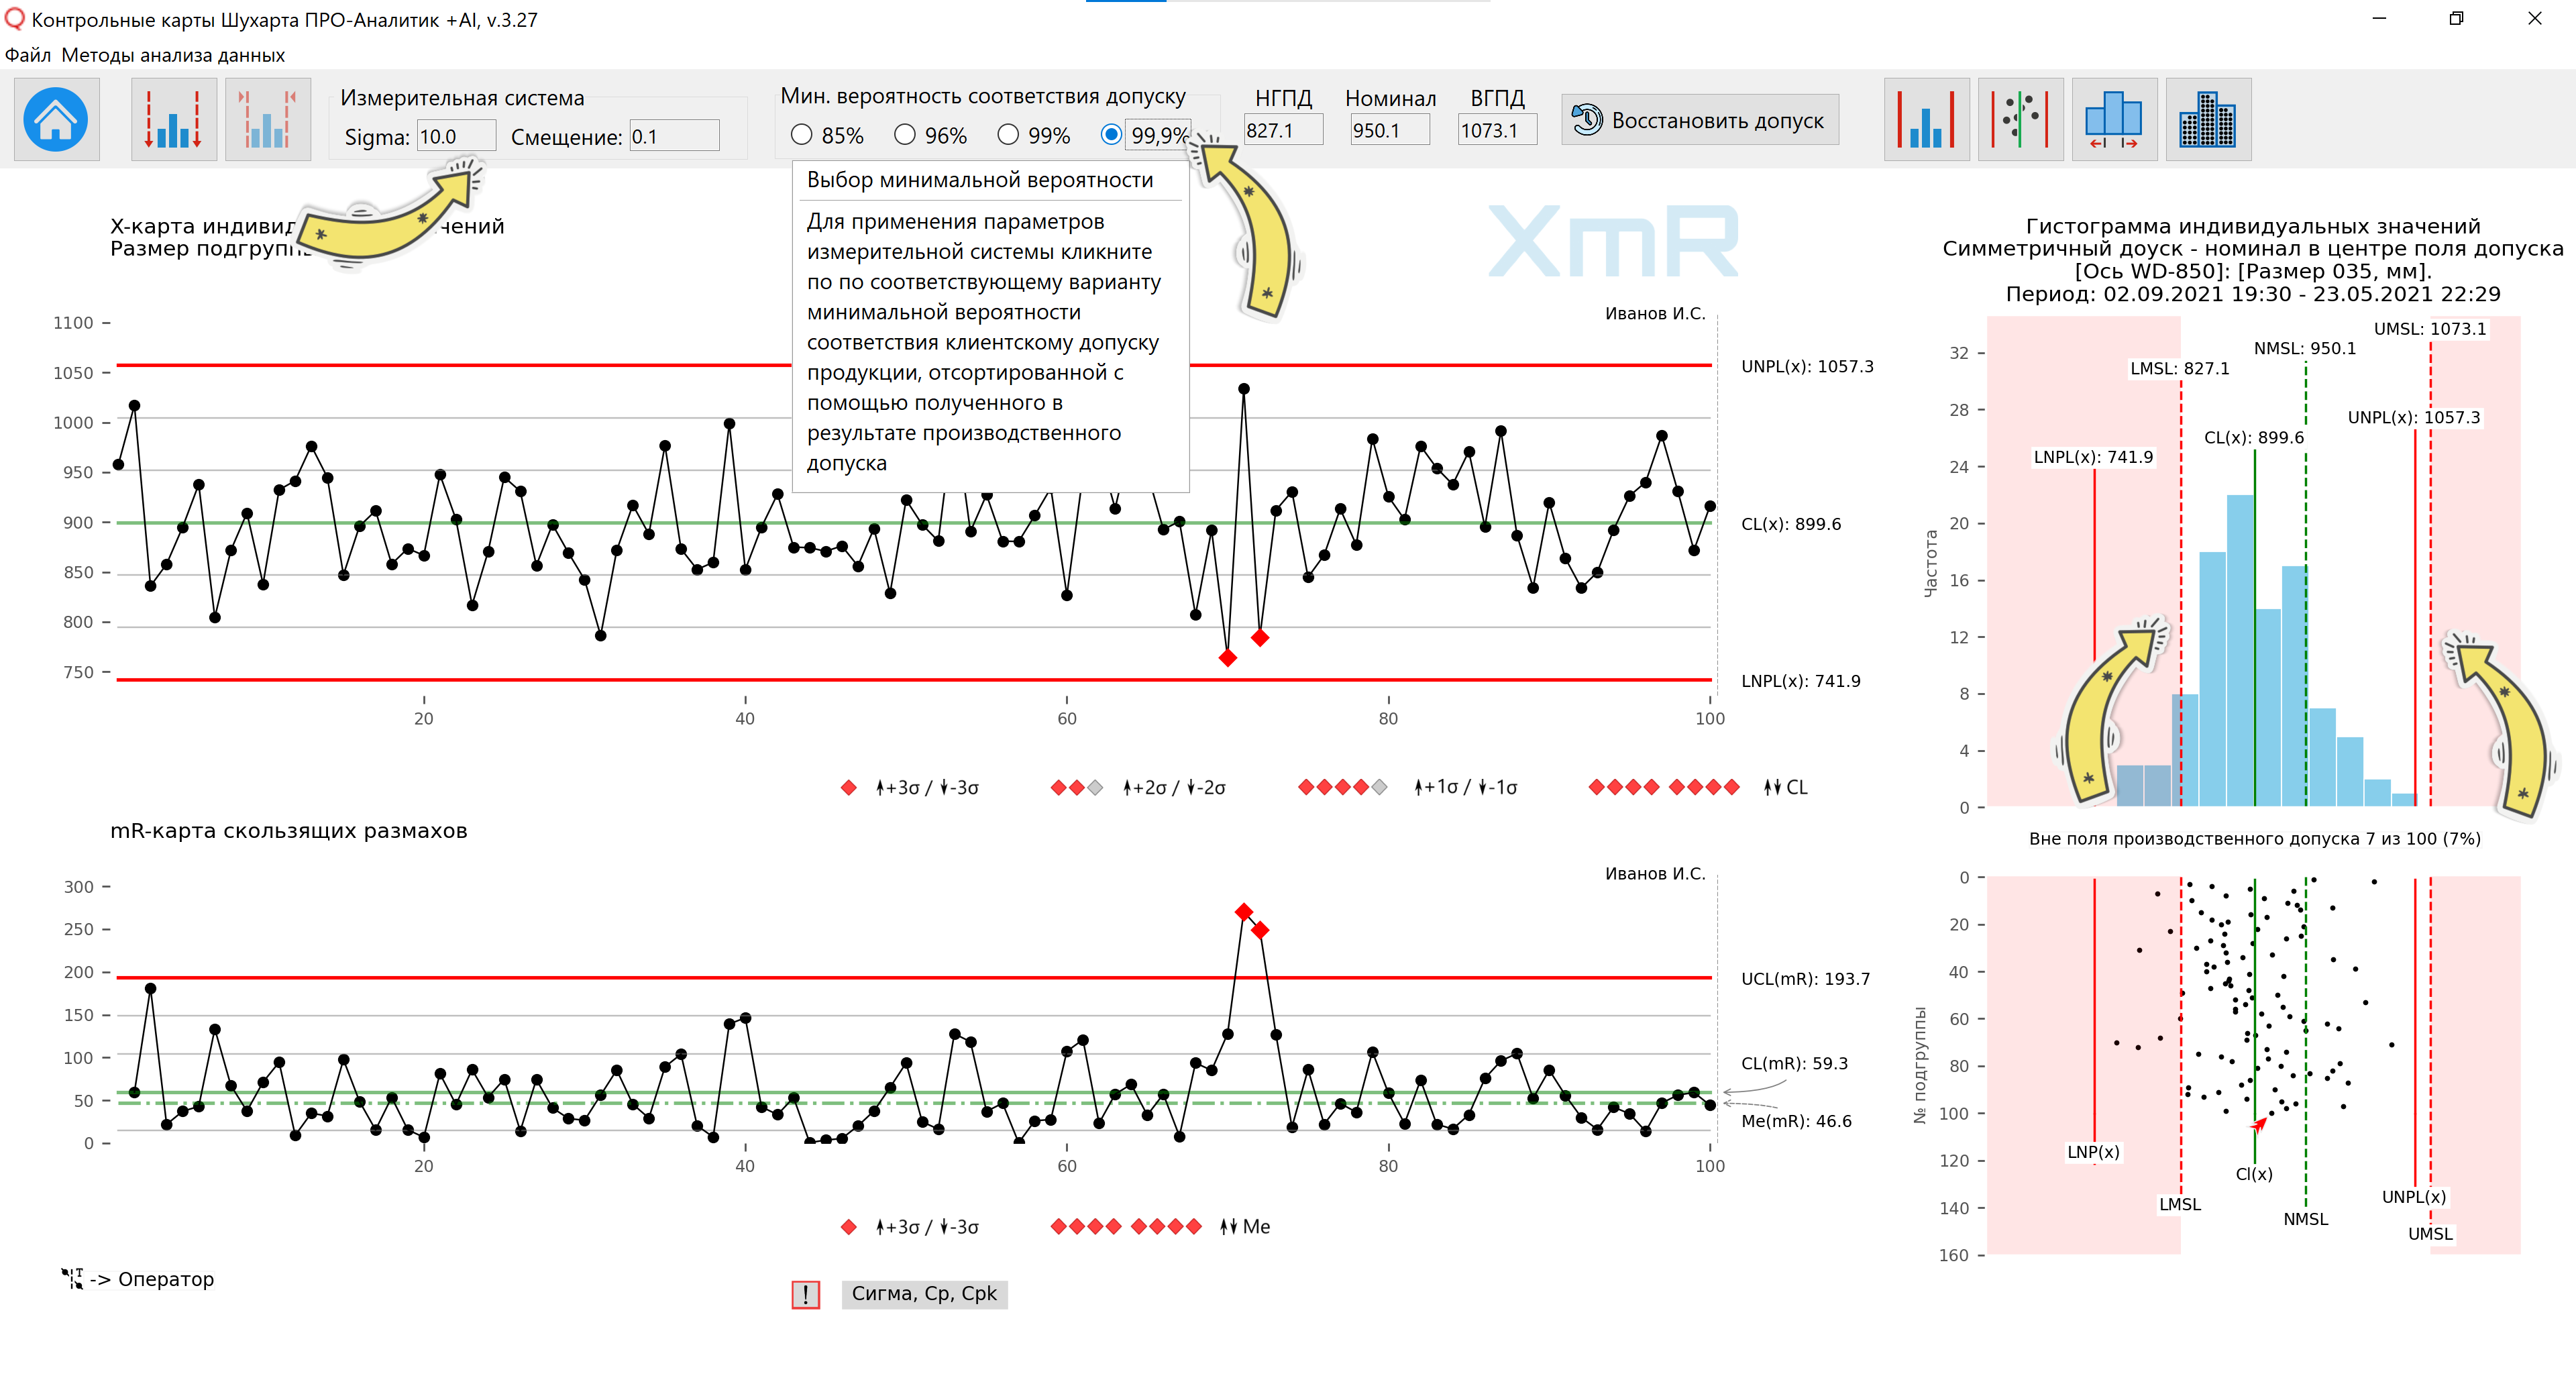
Figure 11. The distribution histogram and scatter plot display the narrowed and shifted field of production tolerance, which takes into account the error (σ) and the bias of the measuring system. The minimum probability (99.9%) of compliance with the customer tolerance of the rejected parts relative to the production narrowed tolerance of the parts was selected (narrowing on each side by 4 (four) probable errors of the measuring system). Legend to the figure: LMSL(x) etc. - Lower Manufacturing Specification Limit / Lower limit of production tolerance; NMSL(x) pr. - Nominal Manufacturing Specification Line / Nominal line of the manufacturing tolerance field; UMSL(x) pr. - Upper Manufacturing Specification Limit / Upper limit of manufacturing tolerance The drawing was prepared using our developed “Shewhart control charts PRO-Analyst +AI (for Windows, Mac, Linux)” .
“The fundamental problem in management, leadership, and production, as my friend Lloyd Nelson put it and as we have emphasized in previous chapters, is a failure to understand and interpret the nature of variation.
Efforts and practices to improve quality and productivity in most companies and government agencies are fragmented, with neither overall competent leadership nor a cohesive system of continuous improvement.
Everyone, regardless of their position, needs training and development. In an atmosphere of fragmented efforts, people move each in their own direction, unable to bring greater benefit to the company, much less develop.”