Analysis of the number of outgoing contacts of the sales department and arbitrary standards imposed by the manager on sellers
Material prepared by: Scientific Director of the AQT Center Sergey P. Grigoryev .
Free access to articles does not in any way diminish the value of the materials contained in them.
In one company where I worked as part of a pilot collaboration, the manager expressed dissatisfaction with sales volumes, and associated this with the number of outgoing contacts of the sales department to current and potential clients.
"Many people know about statistical quality control in production. It is important, but production is only a small part of the overall system. You can achieve 100% success within production and, in the end, go bankrupt. The most important application of the principles of statistical quality control under which I I mean knowledge of the general and special causes of variation in human resource management."
Failure to complete the plan for outgoing contacts on the day threatened employees with a dispute with the manager, and demoralized both parties. There was no question of the sellers being proud of their work. The manager wanted to find out whether such proceedings with sellers were interference in the operation of a stable process or an attempt to eliminate special causes of variations and how to proceed.
My manager and I worked out operational definition outgoing contacts and in accordance with it, salespeople collected data into control sheets during each working day for 10 consecutive weeks. We explained to employees why we were collecting data, which ensured acceptable reliability of the data reported.
For analysis and analytical research, the C-chart was chosen (Figure 1), since outgoing calls are discrete events with a constant definition area of one business day, i.e., they are highly likely based on the Poisson distribution. We were able to verify the correctness of this assumption much later, when we built an XmR-chart based on these data, see Figure 2 below. Why we are talking about the probability of the Poisson distribution, see the article by Donald Wheeler that we translated: Control charts for alternative data (attributes, counts) p-chart, np-chart, C-chart and u-chart or one XmR-chart of individual values? .
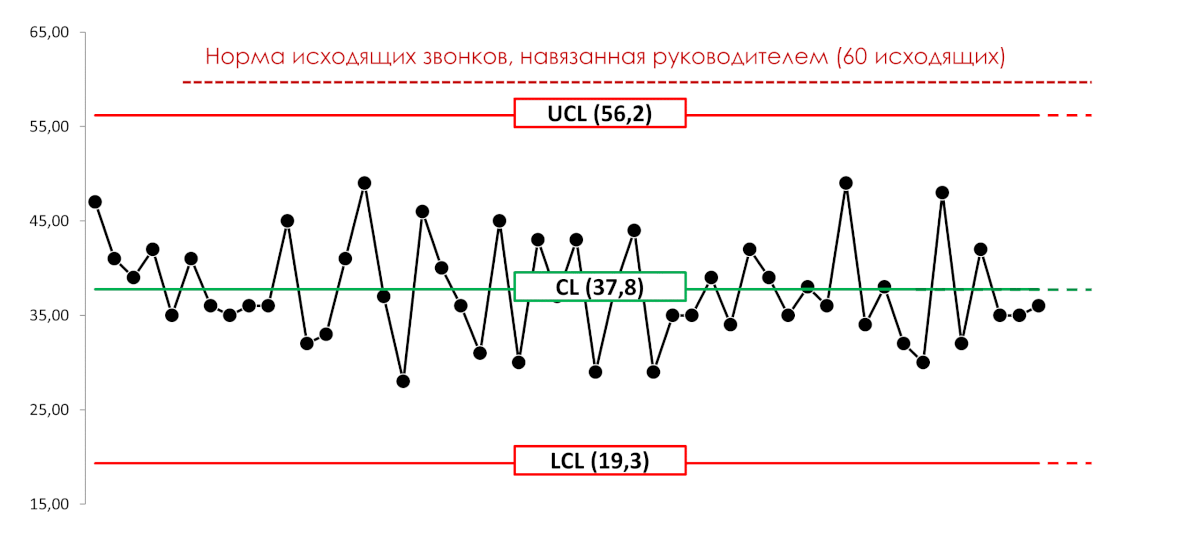
Figure 1. Event C-Chart (outgoing contacts). Legend: UCL(x) – upper control limit of the process; CL(x) – process average; LCL(x) – lower control limit of the process; Y axis – number of outgoing contacts; X axis is the flow of working time with divisions in one day.. Literature: For rules for constructing Shewhart control charts, see GOST R 50779.42-99 (ISO 8258-91) - [11.1] Statistical methods. Shewhart control charts.
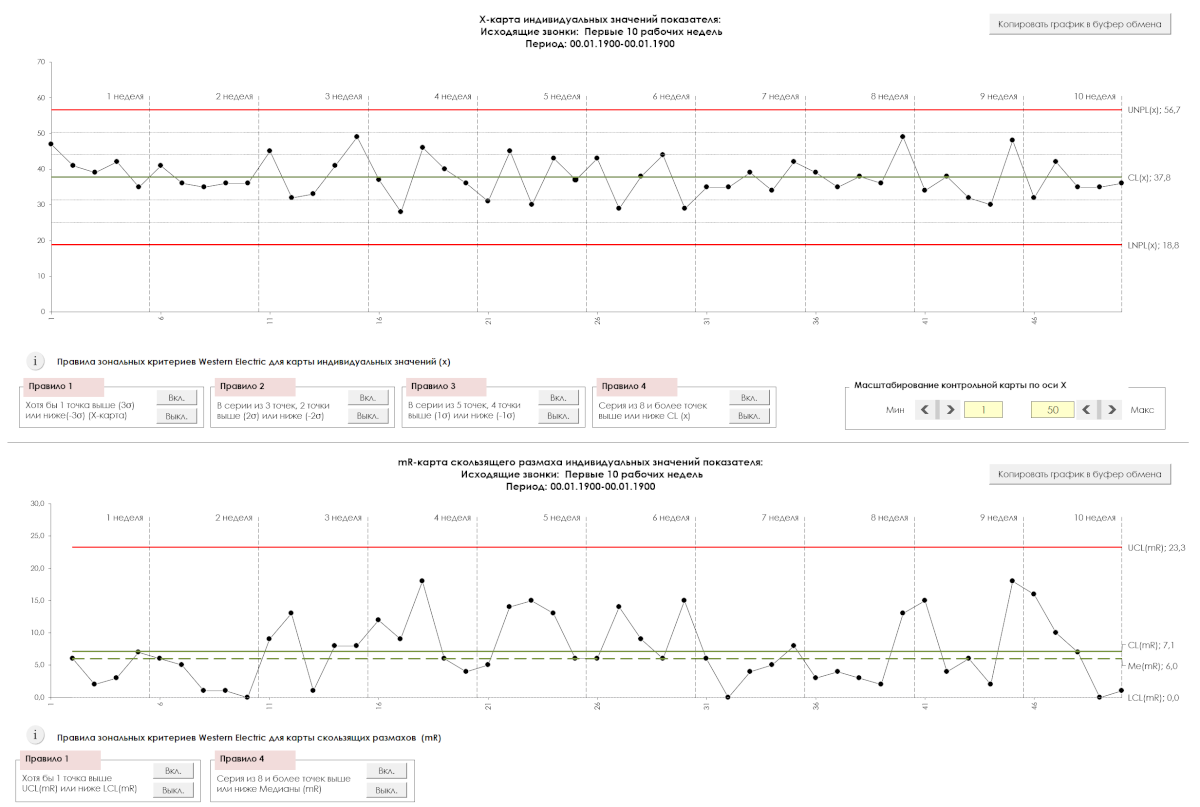
Figure 2. XmR-chart of individual values and moving ranges for discrete values of daily outgoing calls (calculations per constant domain) for the first ten working weeks. The drawing was prepared using the software we developed “Shewhart control charts PRO-Analyst +AI (for Windows, Mac, Linux)” .
The control C-card (Fig. 1) showed that the process of “production” of outgoing contacts during all working days of 10 consecutive weeks was in a statistically controlled state (there are no points beyond the control limits with an average of 38 and upper and lower control limits : 56 and 19 outgoing contacts per day, respectively.
A statistically controlled state indicates that sellers are doing everything in their power, and the identified variability in the number of outgoing contacts is entirely due to the system itself (general reasons), the design of which is the responsibility of the manager himself. The statistically controlled state of a process makes it possible to predict its behavior in the future if it does not get out of control (control charts will immediately show this), or the process system itself is not significantly changed by management.
“A phenomenon should be called controllable when, using past experience, we can predict, at least within some limits, what variations of it can be expected in the future.”
The manager's attempts to deal with every case of low number of outgoing contacts that attracts his attention are interference in the operation of a stable system, and only worsen the matter.
Caution: any interference in a process that is in a statistically controlled state is unacceptable in the form of additional external compensating (reactive) influences on its participants based on the point results of the assessed parameter, for example, punishing the “worst”, rewarding the “best”, giving employees “labels”, ranking personnel according to results, the requirement to fulfill planned indicators beyond the capabilities of a stable system, etc. In any case, such an intervention will increase the variability of indicators up to the point of removing the process from a statistically controlled state, will concentrate the attention of process participants on the individual results of the assessed parameter, internal competition, and not on working in a team according to the goals of the company as a system. See an explanation of the reaction of a stable process to any interference in its operation in Edwards Deming's experiment Funnel and target , as well as a little about the paradigms of managers in terms of staff motivation in the article: Personnel motivation system .
Without changes to the system itself, in which there is a process of “production” of outgoing contacts, it makes no sense to expect other indicators from sellers. Of course, we do not take into account such methods of achieving planned standards as data falsification; or increasing the number of outgoing contacts due to other equally important work caused by the same system; or by additionally hiring new salespeople (increasing company costs).
"An unattainable goal leads to frustration and demoralization. In other words, there must be a way to achieve the goal. But what exactly? When a company puts a person in charge of a goal, it must give him the resources to achieve it."
In my practice, I have encountered a case of management by objectives in the form of a plan for a stable system that exceeds the upper natural control limit of the process by 10 Sigma.
The manager was not happy with this state of affairs and suggested analyzing the next working weeks. Since the previous 10 weeks the number of outgoing contacts confidently demonstrated a statistically controlled state, we extended the control limits into the future for the next 10 weeks, predicting the same results. We mapped the future plan for outgoing contacts imposed by the manager (Fig. 3).
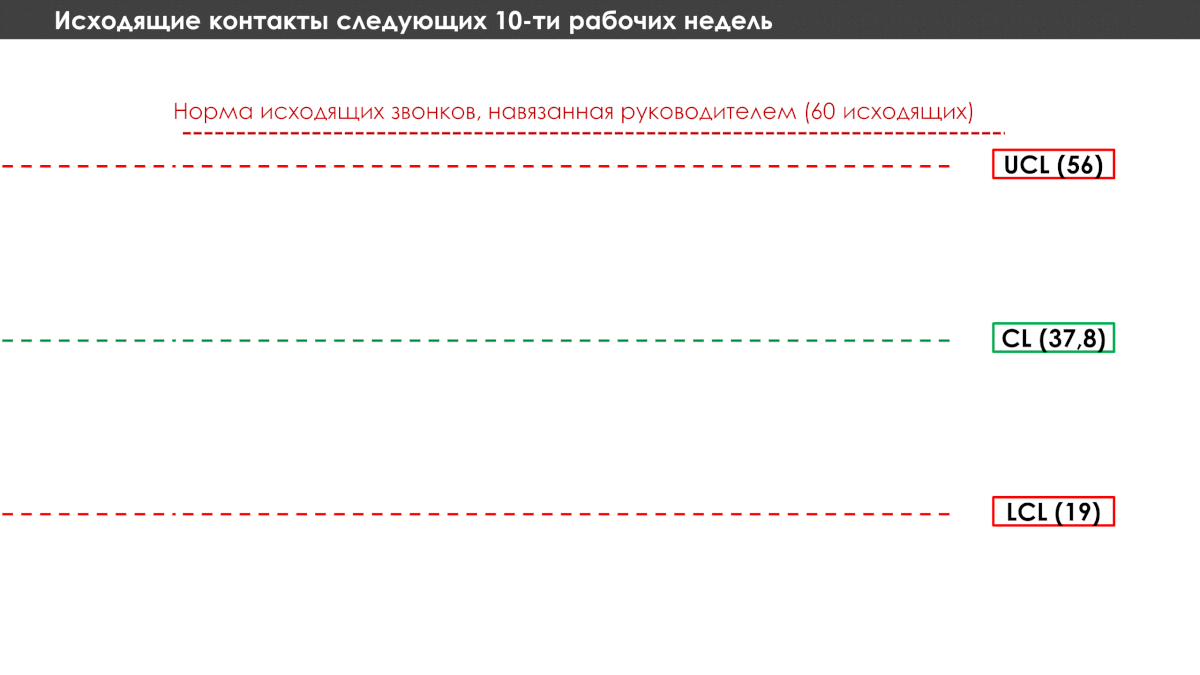
Figure 3. C-chart. Legend: UCL(x) – predicted upper control limit of the process, CL(x) – average of the process, LCL(x) – lower control limit of the process; Y axis – number of outgoing contacts; The X axis is the flow of working time with divisions of one day.
The control chart for the next 10 weeks showed the process being in a statistically controlled state, and the number of outgoing contacts never went beyond the control limit towards the plan imposed by management (Fig. 4).
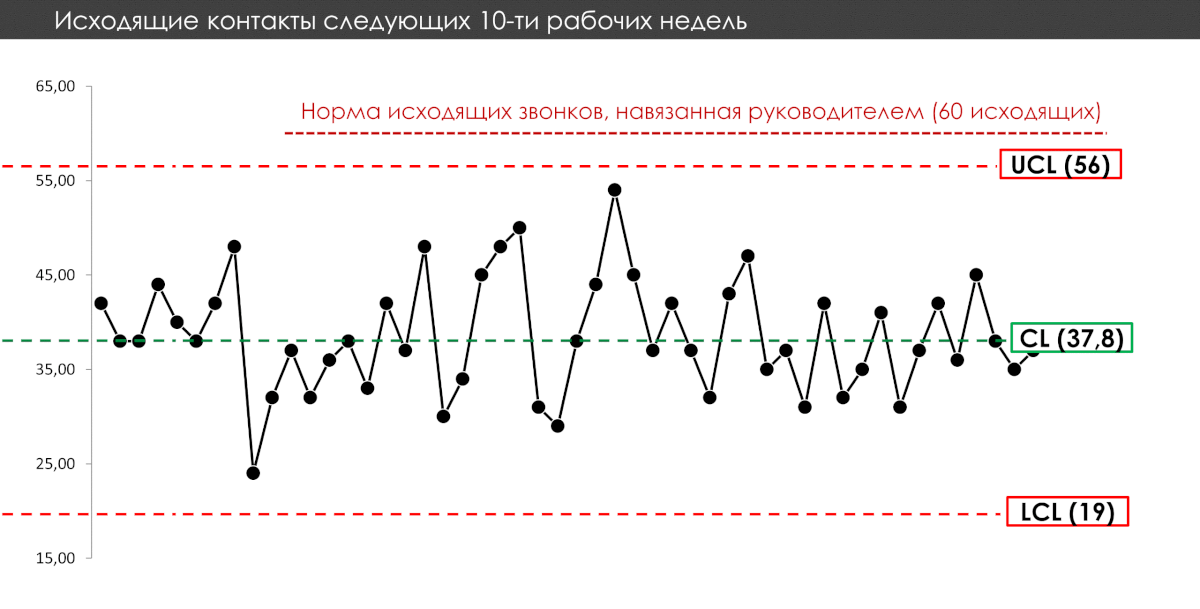
Figure 4. C-chart. Legend: UCL(x) – predicted upper control limit of the process, CL(x) – average of the process, LCL(x) – lower control limit of the process; Y axis – number of outgoing contacts; The X axis is the flow of working time with divisions of one day.
In talking with salespeople, I found that they were unable to make more calls because of the other work they had to do during the workday. They have to find a balance between all the work assigned to them.
I recommended that the manager eliminate imposed arbitrary plans (norms) in the form of the number of outgoing contacts (a goal without methods for achieving it is useless and harmful), stop reactive interference in the process and start optimizing the interaction of all components of the system according to its goals, and not try to achieve suboptimization for any -or indicator (this is his direct responsibility). In his case, only changing the system itself using the methods proposed by Edwards Deming, giving management freedom to be creative in their implementation, can help salespeople make big sales. I deliberately emphasize the term “sales” rather than “outbound contacts.” After all, it is increasing sales that interest the manager and are the goal of the system as a whole.
To improve the system in Edwards Deming's experiment with red beads , it was enough to change their content in the incoming raw materials - a mixture of red and white beads.
Continuously improve the performance of multiple process inputs by minimizing variability and tuning the average to optimize the entire system using the critical tools of Shewhart control charts and Edwards Deming methods.
“Hopes without a method for their implementation will continue to be hopes. The Fourteen Points of Management and the elimination of deadly diseases and obstacles provide such a method.”
And when changes are made, to assess their effectiveness it will be enough to analyze the progress of the process relative to the control limits built before the changes and extended into the future. If the control chart reveals the exit of a process from a previous statistically stable state and transition to a new stable state, this will indicate the degree and quality (improvement or deterioration) of the system changes made. If not, your actions were useless for the analyzed indicator.
Later, using our software, we built a control XmR-chart for all 20 weeks using the function of fixing control limits calculated from the first to the tenth week inclusive, see Figure 5. Although this did not change the conclusions about the capabilities of the system and the unreasonability of the management’s excessive requirements for process, it was possible to continue to examine the process more closely.
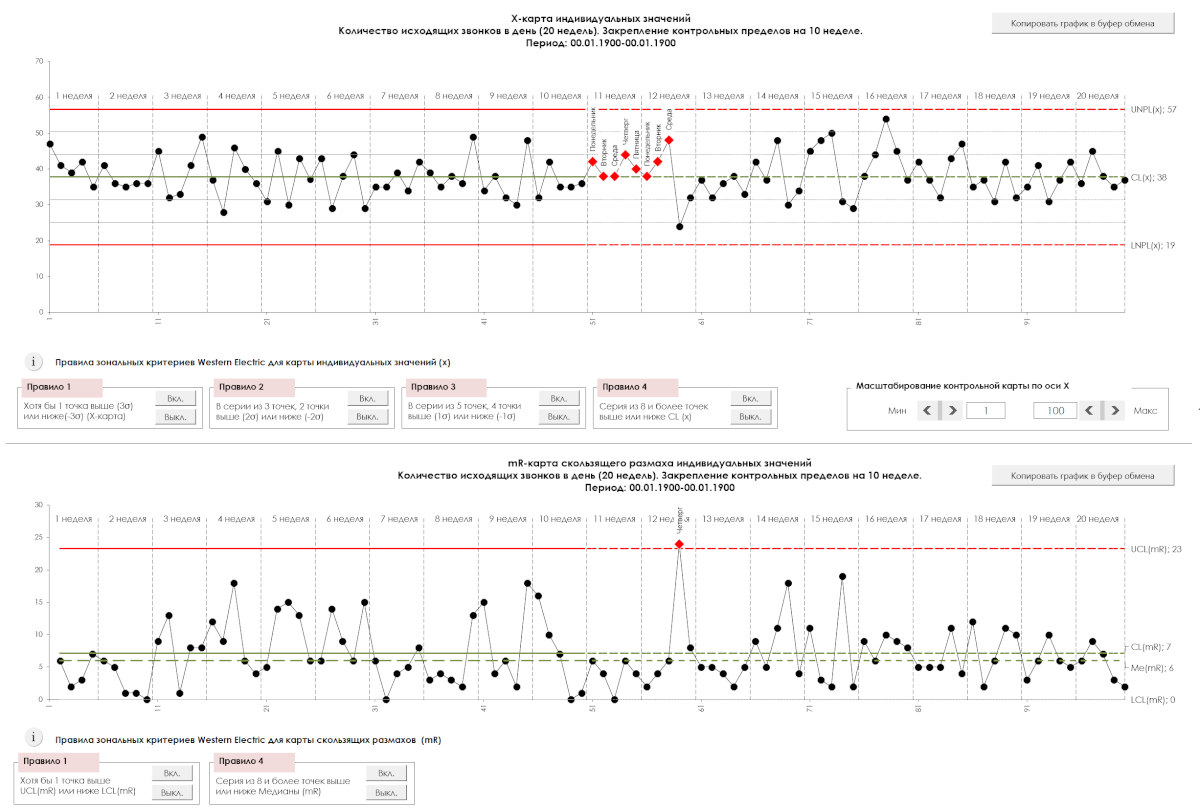
Figure 5. XmR-chart of individual values and moving ranges for discrete values of daily outgoing calls (calculations for a constant definition area) with control limits, center line and median line Me(mR) fixed for the first ten working weeks. The drawing was prepared using the software we developed “Shewhart control charts PRO-Analyst +AI (for Windows, Mac, Linux)” .
Applying all four Western Electric zonal criteria rules to the X-map (top graph) revealed a slight shift in the series of eight points throughout the eleventh and part of the twelfth week above the average process anchored over the first ten weeks. When a process exhibits a state close to a reasonable degree of statistical stability, attention should be paid to such a shift in the series of points and the special causes that caused it should be determined.
Applying Western Electric Zone Criteria Rules 1 and 2 to the mR chart (bottom graph) revealed a specific cause that occurred between Wednesday and Thursday of the twelfth week. It was necessary to deal with this special reason using “fresh tracks”.
If we had built not a C-chart, but an XmR-map of individual values, we would have paid attention to the signs of the presence of special causes that were subsequently identified and would definitely investigate them. Why it is better to immediately build an XmR-chart for any discrete values and shares, see the article by Donald Wheeler that we translated, the link to which we have already given above: Control charts for alternative data (attributes, counts) p-chart, np-chart, C-chart and u-chart or one XmR-chart of individual values? .
At PQ Systems, we use Shewhart control charts in our sales, support, accounting and other systems. By tracking the number of outgoing and incoming calls, length of time on calls, number of contacts in each period, and other inputs, with Shewhart control charts we can track trends and set realistic expectations for individuals and the department as a whole.
You will not find a single accountant in our company presenting the net profit this month compared to last month. Instead, the net income for the reporting month is shown on the Shewhart control chart along with the previous 24 or 36 months.
One of the biggest benefits of control charts is that subjectivity is minimized and decisions are made based on the data collected. The voice of the process tells you what is happening. When changes are made to a system for improvement, the Shewhart Control Chart will show you how the process behaves after the change so you can determine the resulting effect.
Watch a film about the method of quickly diagnosing changes in a process (system), both positive and negative, using the Shewhart control chart.
Video 1. A method for quickly diagnosing changes in a process (system).
How to reasonably evaluate the performance of individual employees on a selected parameter, in a statistically significant period, see the open solution: Erroneous use of KPIs in the personnel motivation system .