Quality or quantity? Piece work or time work? What instead?
Material prepared by: Scientific Director of the AQT Center Sergey P. Grigoryev .
Free access to articles does not in any way diminish the value of the materials contained in them.
My comments to the article below about exceeding the target by 400% at one manufacturing plant turned out to be almost unnecessary. What happens at enterprises with a similar management style has long been written by authoritative world-class authors, whose quotes came at just the right time.
“Most successful companies turned out to be so simply by chance, because in their practice they use the worst and most ineffective management methods.”
Top management, using piecework wages, actively provokes employees of the enterprise to various kinds of tricks in order to achieve greater rewards.
An article demonstrating the consequences of using piecework wages: “Is the workshop exceeding the plan by 400%? The security service is looking into it.”
“It’s good when a workshop fulfills the plan. It’s even better when it exceeds it. However, if a site achieves 400 percent of the plan, then this is a reason to think and ask: what kind of plan is this that can be exceeded four times over?
The security service of the VSMPO-AVISMA Corporation inquired about the amount of sweat and blood that goes into such a level of labor productivity, having studied the super-impactors in the section of the rotary lathes of the workshop, where they showed miracles of exceeding the plan.
It turned out that the Gorestakhanites showed a very understandable, from the point of view of self-interest, initiative and arbitrarily made adjustments to the control computer programs.
These corrective actions forced the machines to reduce the time allotted by the technology for machining products. It took less time to produce one unit of production, and more units of production were produced per shift. More than what was given according to the plan at least four times!
Machine operators, without agreement with technologists, repeatedly changed processing modes: they increased the cutter feed rate and cutting speed, and skipped certain parts of the program.
And everything would be fine, but the excessive load on the machines entails premature wear and breakage of expensive cutting tools, threatens the failure of individual components, and increases the risk of producing non-conforming products.
To catch the “innovators,” specialists from the economic security department organized a raid on the workshop. They came suddenly. We verified the parameters in the machine control with the requirements specified in the documents. This is where the reason for such high “labor productivity” on the site was discovered.
The machine operators did not deny the obvious and, without any objections, familiarized themselves with the order to deprive them of their bonus for violating the technological process. The shop manager is instructed to develop corrective measures to ensure that process violations are avoided.
It must be said that not a single product was damaged by the “enthusiasm” of ten rotary turners from among the “shock workers” of the workshop.”
The article demonstrates another example of bad practices in enterprise management. Everything is as usual. Management by numbers, external motivation, piecework.
Damaged machines and tools are the least that the management of the enterprise should have foreseen. How do the properties of the material change with such accelerated processing? How many of these parts reached customers? How much does it already cost at critical facilities? Of course, no one knows this.
And what do the risk managers of customers who “successfully” conducted their audits at this enterprise think about the “undamaged” parts manufactured for them in violation of technology?
"Your factory uses a piece rate system. There is no better guarantee for poor quality work."
How many other types of products does this enterprise make on a “shortened”, “low-cost” and “optimal” basis without the knowledge of the technologists and shop management or with their tacit consent?
Who at this enterprise is responsible for ensuring that workers comply with the technology of processing parts? I think the answer is obvious, everyone involved in the deal is only concerned about exceeding the plan.
The article demonstrates the low quality standards in this company.
Who sets the target value at this enterprise and how? If a plan is needed to plan deadlines for order execution, what value does the enterprise use for this? If the basis for calculating such a planned number is the average time of optimally performed operations of a stable process in compliance with the technology, then how could one even expect to exceed the plan by an average of even 30%? Ask questions to the site foreman, what does he think about this? What will the production director answer? What about the quality director? What about the Director of Operational Excellence? What about the CEO?

"There is no substitute for knowledge. But the prospect of using knowledge is scary."
Important!
Refusal of piecework wages does not imply equalization. Equating outstanding employees (objectively superior to the capabilities of the system, and not in a privileged position) with those who work within the system and, even worse, with those who work outside the system with worse results, is as destructive as piecework.
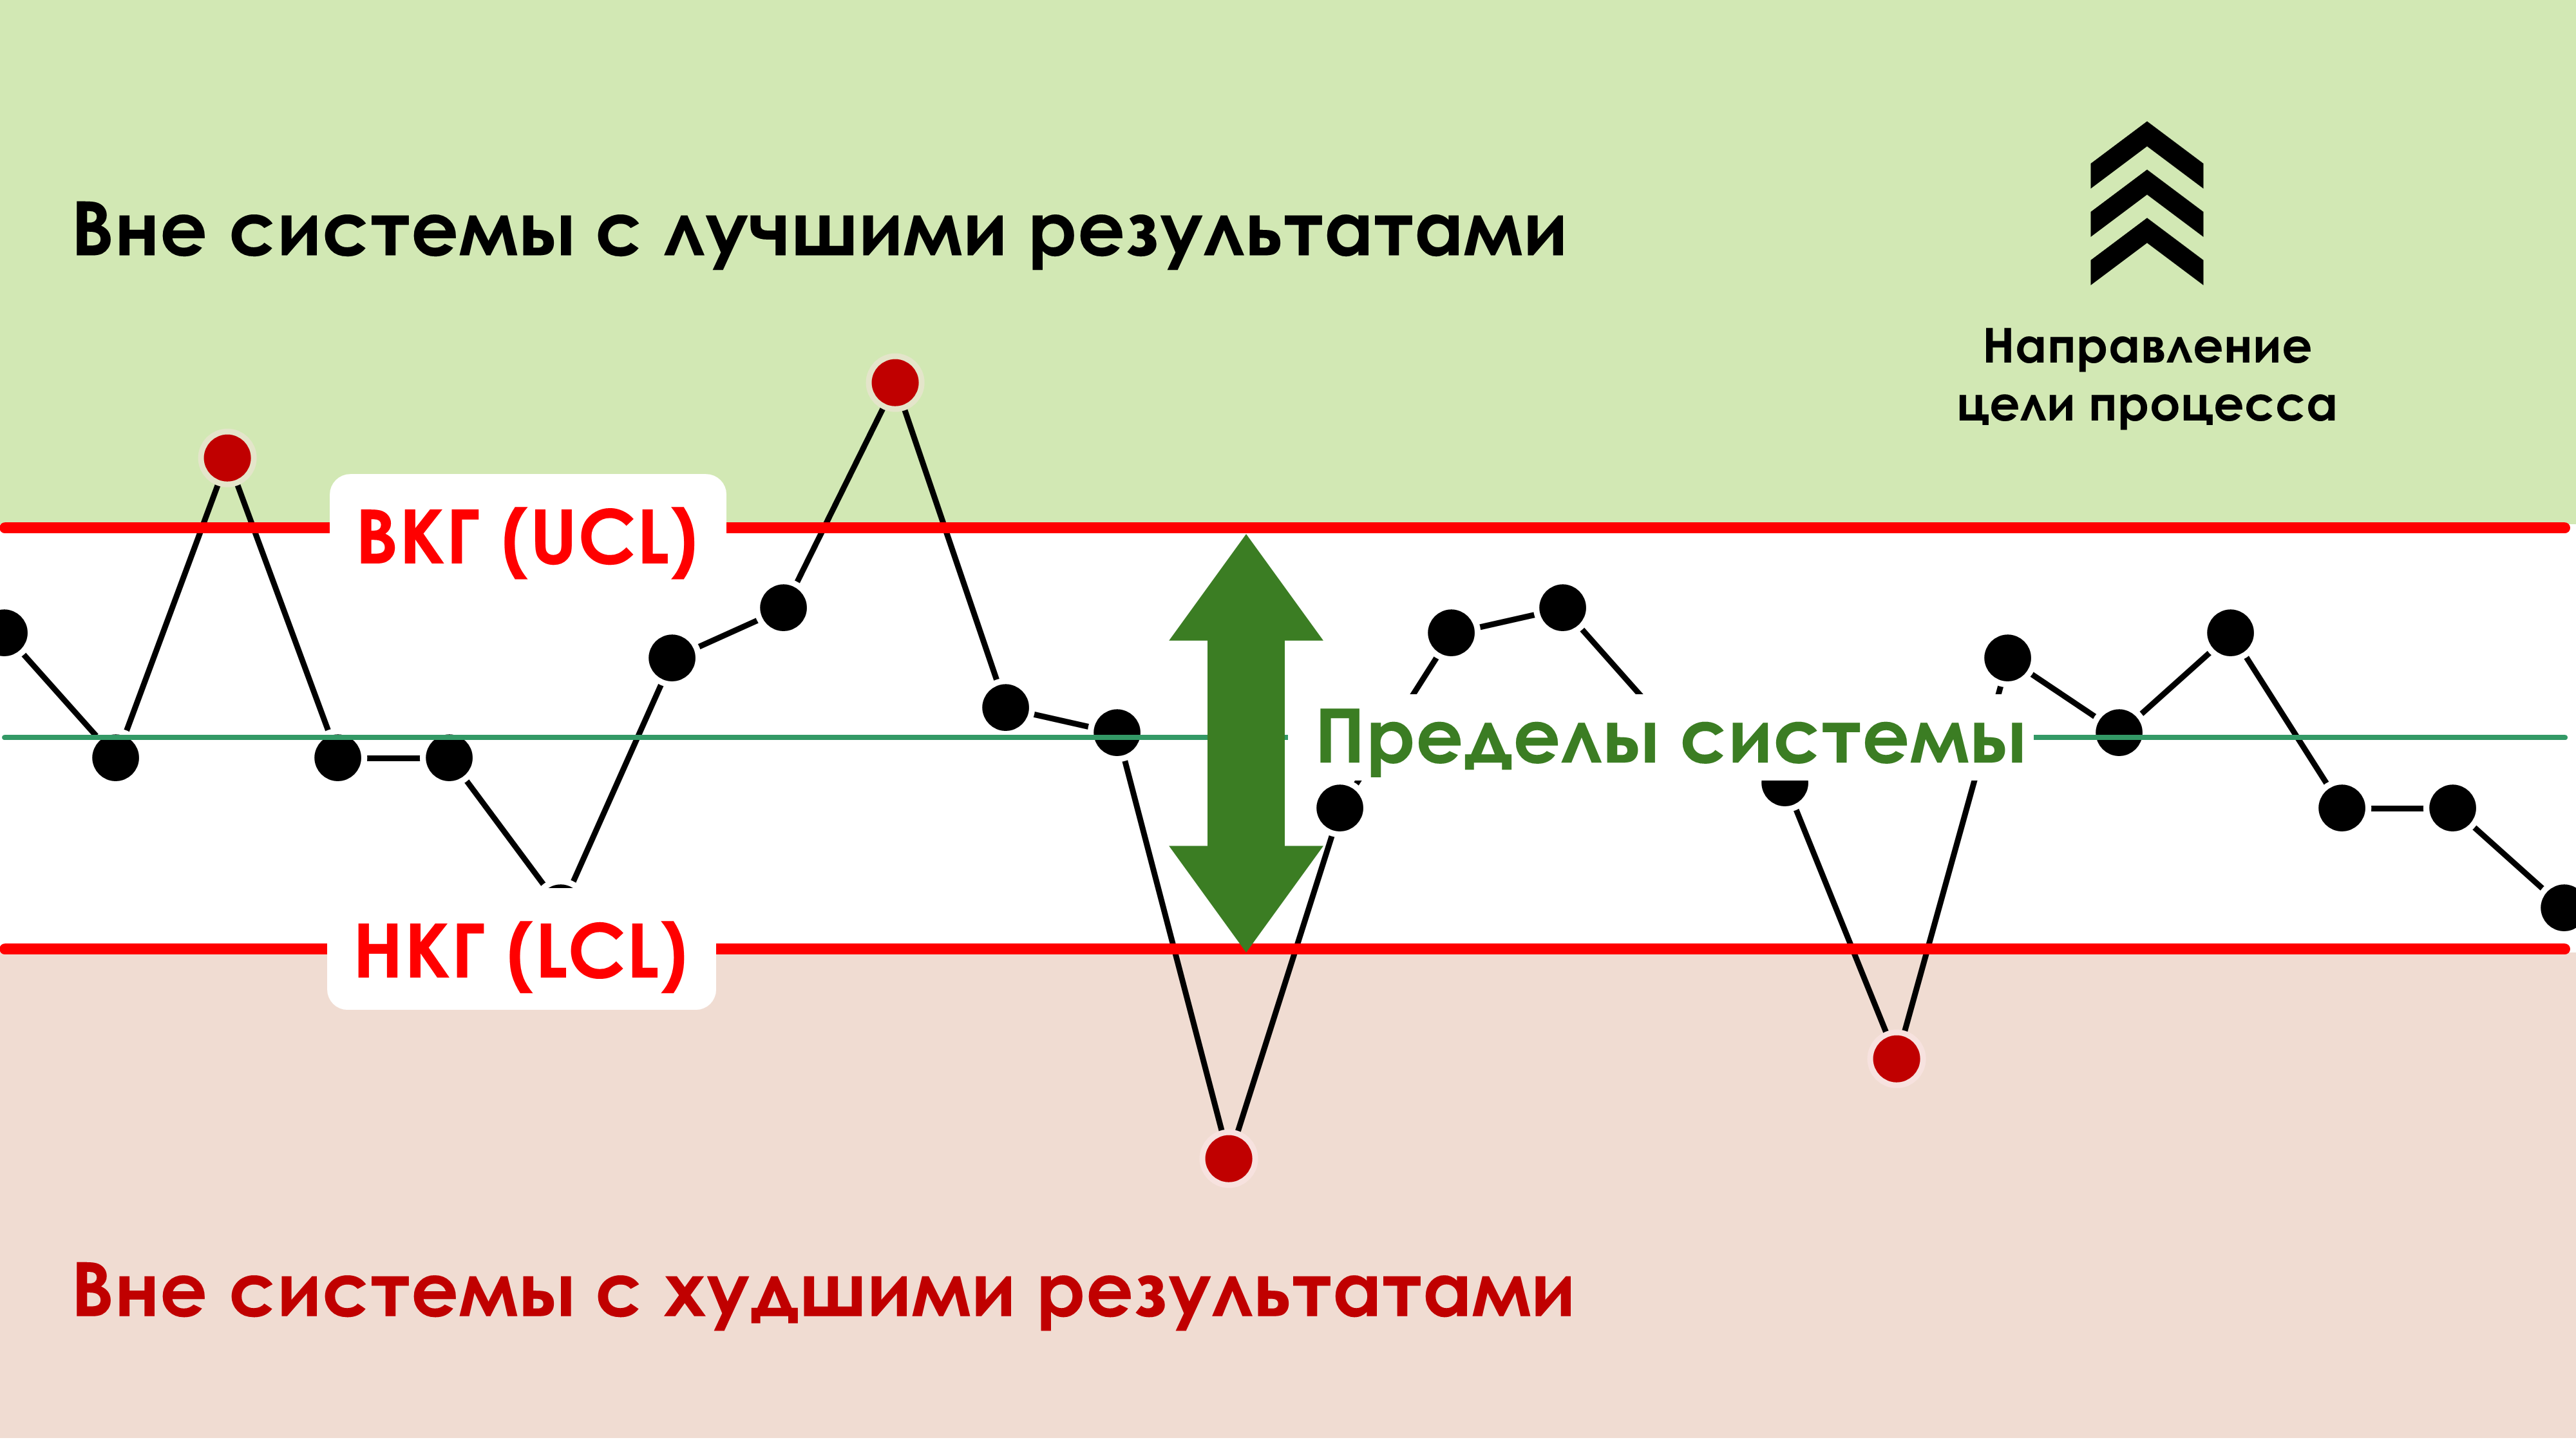
Figure 1. System limits in terms of Shewhart control charts.
For an explanation of what numbers are reasonable to use in scheduling and what to expect from stable processes, see the open source solution: Statistical Process Control (SPC) vs Standardization of Manufacturing Processes and Operations . And in order to understand who really deserves more reward, who can be left alone, and who needs help, see the open solution: Erroneous use of KPIs in the personnel motivation system .
Only the top management of this enterprise, who approved the payment for the transaction, motivating people to look for such tricks, is responsible for what is happening! It must be that all the production divisions of this enterprise, sitting on the deal, no matter what, are busy searching for methods of “increasing productivity” similar to the method of the “machine operators” described in the article.
The best solution would be to completely abandon piecework and focus the attention of workers and shop management on quality and careful treatment of equipment and tools. In the meantime, management has not dared to take this only right decision, maintaining a simple control chart of the average and range of subgroups, which will easily allow one to identify such “optimizers” who have succumbed to the temptation when assessing the capabilities of the system. See the example in Figure 2 (in the context of the article), where a virtual operator (technologist) performing all operations in compliance with the technology found himself outside the system with the worst results in terms of cycle time. In this case, the system limits are calculated for all operators including virtual ones. This signals that in this case the actual system limits are statistically significantly different from the system limits that would be expected if most operators followed the technology. Cameraman Ivanov S.I. surpassed all the “optimizers”, being located outside the system with the best cycle time indicators - he should be given special attention.
In our software there is a function of rational grouping of data according to sources of variation; in this case, such source of variation is machine operators.
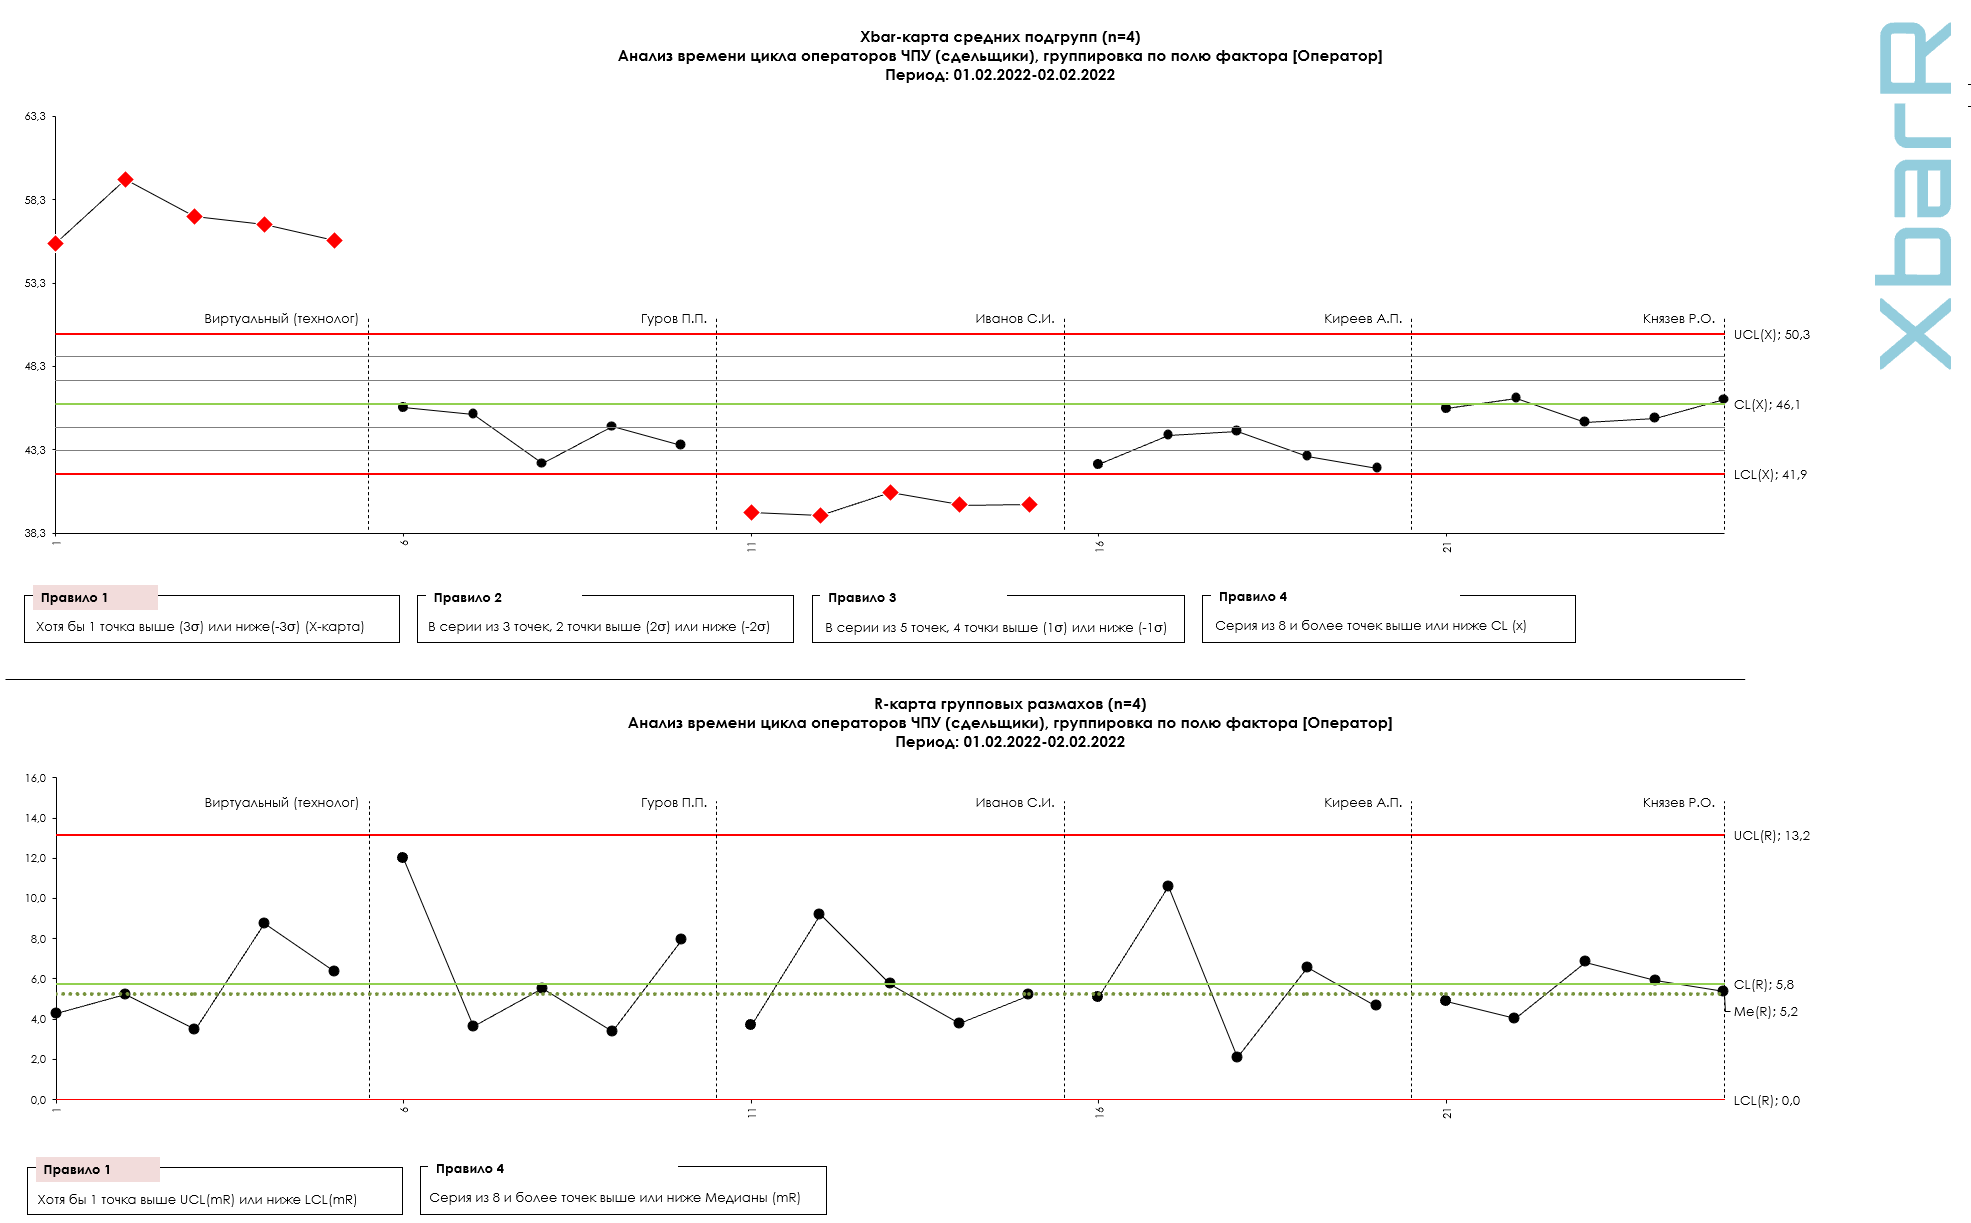
Figure 2. Assessment of system performance capabilities (cycle time) on the XbarR-chart of averages and ranges of subgroups. In Figure 3, the XbarR-chart of subgroup averages and ranges is built for individual series of individual productivity (cycle time) for all operators. We see that the average cycle time of all operators is higher than the average cycle time of a virtual operator (technologist) by only 8-15%, and this was enough for the virtual operator (technologist) to be outside the system with the “worst” results of the cycle time of the controlled operation. The drawing was prepared using the software we developed “Shewhart control charts PRO-Analyst +AI (for Windows, Mac, Linux)”
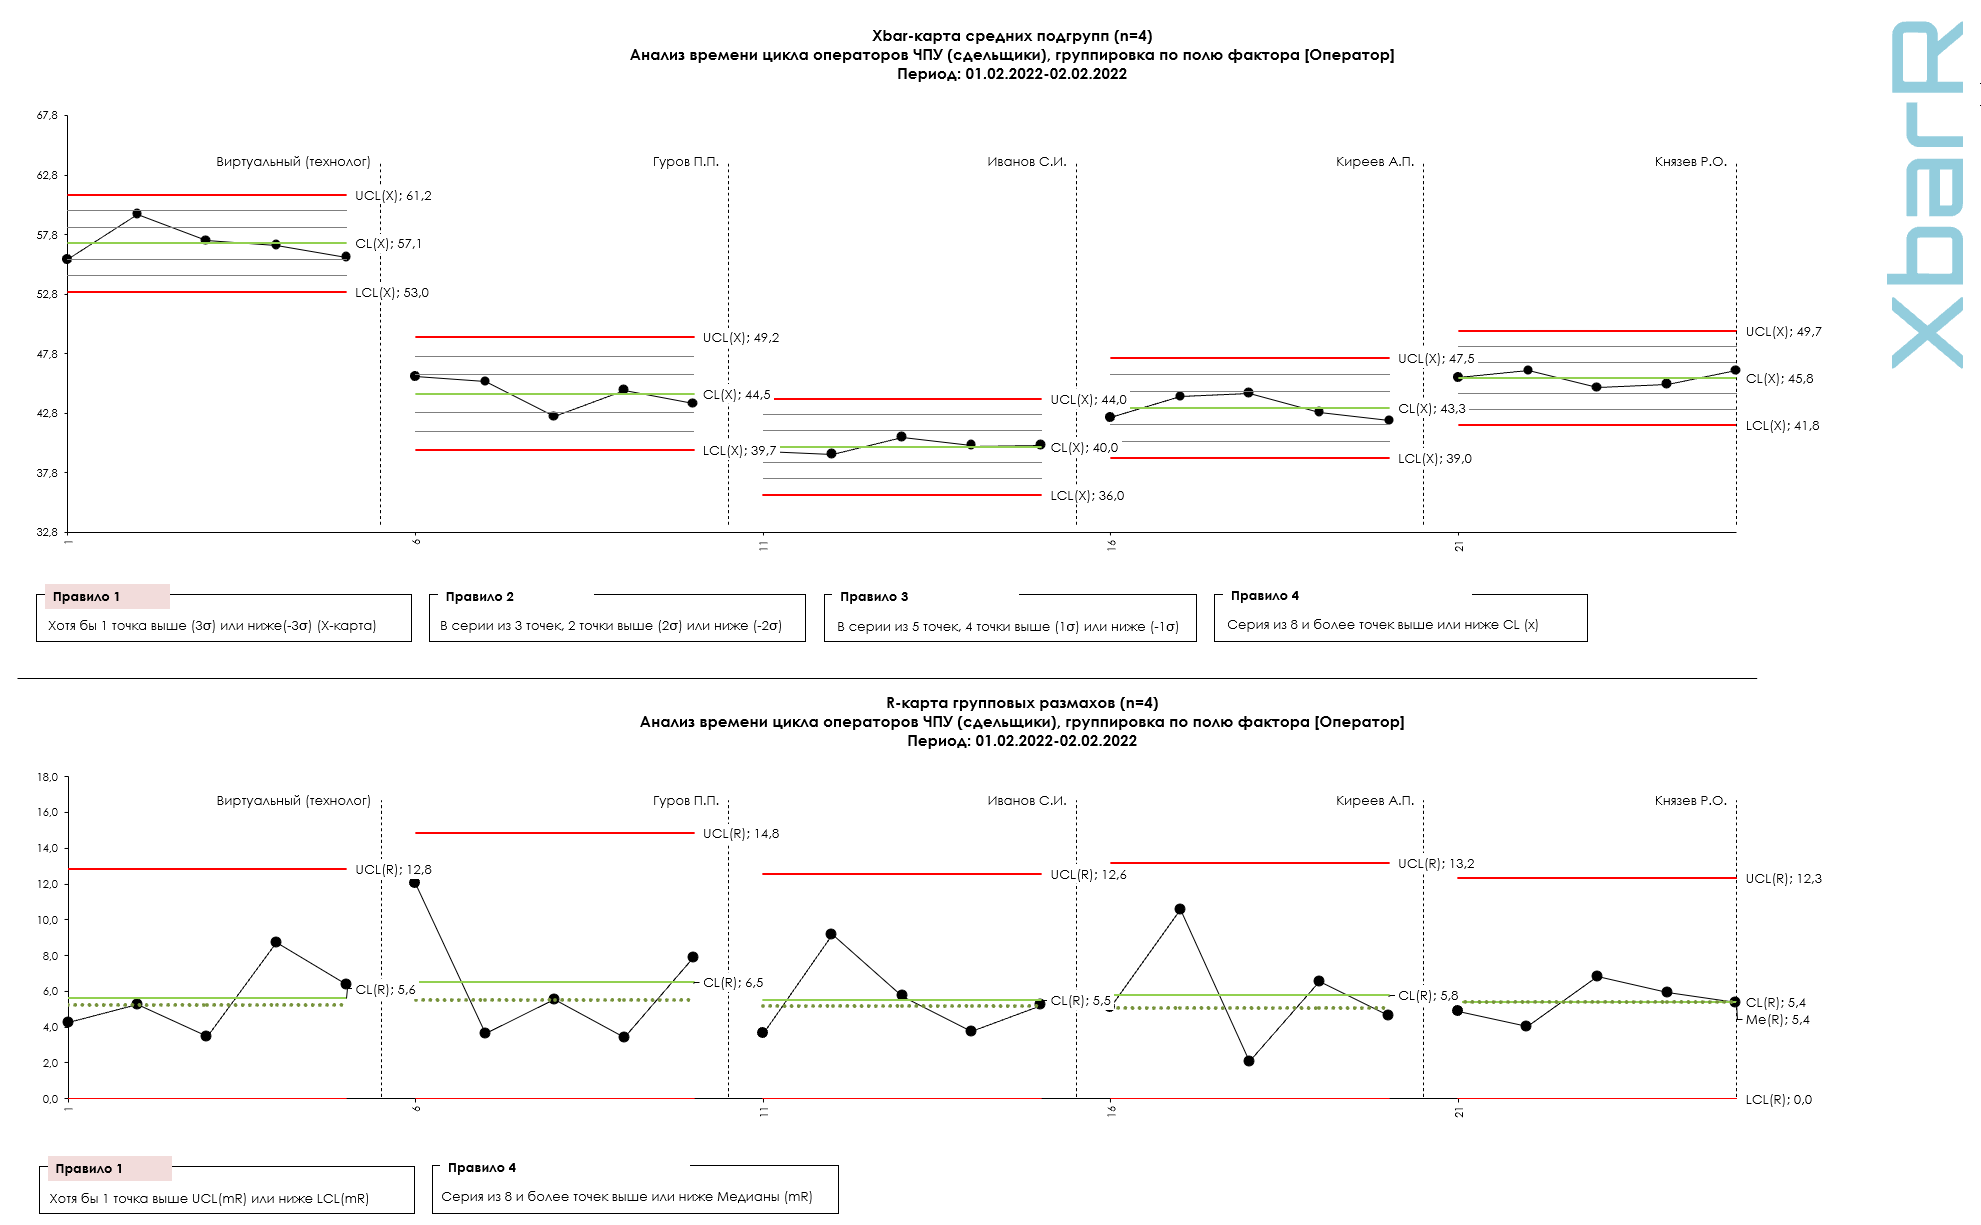
Figure 3. Estimation of individual performance (cycle time) on the XbarR-chart of subgroup means and ranges. The drawing was prepared using the software we developed “Shewhart control charts PRO-Analyst +AI (for Windows, Mac, Linux)” .
For an example of using control charts to evaluate the work of people in the system, see the open source solution that I already mentioned above: Erroneous use of KPIs in the personnel motivation system .
“Personnel certification and ranking systems, assessment of personal contribution, ranking by importance, bonus systems, piecework pay have a destructive effect.
“Myopic” thinking develops, rivalry, intrigue and fears are nurtured, long-term planning is destroyed, and team spirit is destroyed.”

Figure 4. Games with numerical norms and planned tasks.
“Very often the set numerical standards cannot be met because they exceed the actual capabilities of the system. But since the position of people or departments may suffer if these tasks are not met, they have to do everything to create the impression that the task has been completed.
Thus, they are forced by the current system to play unpleasant games: falsify, distort reports or feign frantic activity to achieve goals, instead of improving the system. All these charades force us to protect access to real information from strangers and create big or small lies and disinformation. The greater the pressure to achieve an unattainable result, the greater the likelihood of deception."
So what should management focus on, quality or quantity? The answer has long been given in Deming's Chain Reaction:
Improve quality
Costs will be reduced due to fewer errors, rework and delays, as well as better use of machine time and materials.
Productivity will increase
Capture the market by offering better quality at a lower price
Stay in business
Save and increase the number of jobs
"A little bit of folk wisdom. In America, there is a common belief that quality and production volume are incompatible - you can't have both at the same time.
The business manager will most likely tell you that this is an “either-or” situation. He long ago came to the conclusion that if quality improves, then production volume begins to fall. If production volume increases, quality suffers. The thing is that this manager does not know what quality is and how to achieve it.
A clear and compelling answer to my question: “Why does productivity increase when quality improves?” - I received from 22 industrial workers at a meeting with me: - Less rework - you couldn’t say it better.
Another answer is often found: - Not many losses.
Quality for a production worker is, first of all, the opportunity to receive satisfaction from work and to be proud of one’s skills.
By improving quality, we turn wasted man hours and underutilized machine time into excellent products and superior services. As a result, a chain reaction occurs - costs are reduced, competitiveness increases, people in production feel happier, and jobs increase.
A clear definition of the relationship between quality and productivity was given by my friend Dr. Yoshikasu Tsuda of Rikkyo University in Tokyo in a letter he wrote to me from San Francisco on March 23, 1980:
“I have just returned from the Northern Hemisphere, having visited 23 countries in a year, where I visited many industrial enterprises and talked with many specialists. In America and Europe, people are now more interested in quality costs and quality audit systems. But in Japan, we are primarily committed to improving quality through your methods... When we improve quality, we increase productivity, and this is exactly what you predicted for us in 1950.”
Dr. Tsuda says Western industry is trying to improve quality, but not beyond what the data suggests is cost-effective. Someone asked: “How much can we reduce quality without losing customers?” This question is the height of misunderstanding of the problem. And this is a typical reaction of American management. In contrast, the Japanese stubbornly move forward and improve the process without looking at the numbers. This is how they increase productivity, reduce costs and conquer markets.
Awakening of Japan. In 1948 and 1949 Some Japanese company executives have made the discovery that improved quality naturally and inevitably leads to increased productivity. This observation was the result of the work of a group of Japanese engineers who studied quality control literature obtained from Bell Laboratories specialists working on the staff of General MacArthur's occupation administration. Among the books was Walter Shewhart's Economic Control of Quality of Manufactured Products (Van Norstrand, 1931; reprint of the American Society for Quality Control, 1980). The results were astounding and showed that productivity did indeed improve as variation was reduced, just as the methods and logic of Shewhart's book predicted. The visit of a foreign expert in the summer of 1950 initiated a chain reaction of quality improvement in Japan that became their way of life. The diagram of this chain reaction hung on the board during each of our meetings with senior management in Japan starting in July 1950 (see Fig. Deming’s Chain Reaction above. - Note by S. P. Grigoryev).”
Shewhart's book [13.1] "Economic Control Of Quality Of Manufactured Product" mentioned by Deming can be downloaded in the section bibliographies our website
P.S.
Please note that the above quotes are not about Russian management, but about American management. But Russian management is a great learner. It’s a pity that it’s not for those and not for what it should be. Now these quotes accurately characterize the style of Russian management.