Without integrating statistical control methods into automated process control systems, automated control systems and data management systems, automated control systems, automated control systems, you will increase the number of errors of the first and second types made when controlling technological processes.
Material prepared by: Scientific Director of the AQT Center Sergey P. Grigoryev .
Free access to articles does not in any way diminish the value of the materials contained in them.
Operators of automated process control systems or automatic regulators, in attempts to control processes, constantly make errors of the first and second types, not understanding how to distinguish noise from a signal, reducing the economic efficiency of controlled processes and increasing the likelihood of emergency incidents.
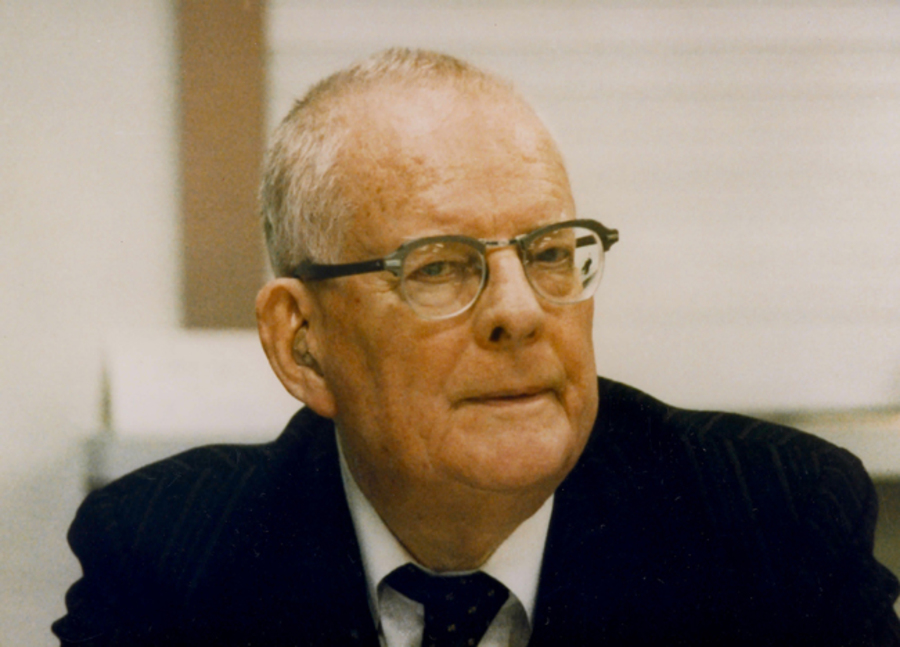
"There is no substitute for knowledge. But the prospect of using knowledge is scary."
Process control system and automated control system software products from companies such as Siemens, GE, etc. already use integrated statistical process control modules (separating natural process variability and unnatural variability caused by special reasons), the main tool of which is Shewhart control charts. But these companies also failed to notice the main advantages of statistical methods for upstream process control, using them only in quality control modules for the resulting multifactor production processes.
Any aggregated indicator (resultant) hides the signals in the data sources of variability, turning them into noise at the resultant level, thereby depriving staff of the ability to see what needs to be done to improve processes in the first place. At the same time, any reactive actions of the operator of the automated process control system or automatic controllers to noise is an error of the first kind, which only worsens the situation. It is important to understand that at a high level of aggregation, only catastrophic changes will be noticeable in the form of signals (Edwards Deming).
"Upstream search is a powerful lever in solving mixture problems."

Figure 1. Upstream search is a powerful lever in solving mixture problems.
A system assistant in finding and eliminating special reasons for technological processes going out of control (out of a statistically controlled state) should be a visual display of control charts in the operator interface for all identified elements of the cause-and-effect relationship. Moreover, the state of statistical controllability of monitored indicators of causes (factors) can be assessed both from data coming from sensors and from data from other subsystems that record events online (for example, incoming quality control of raw materials, data from a testing laboratory and interoperational control ).
Moreover, statistical control methods make it possible to identify the presence of factors (general and special causes of variability) that are not monitored by your process control systems, but that significantly influence the amount of variability and stability of technological processes. Such factors must be operationally defined, they must be assigned metrics for control in the process control system.
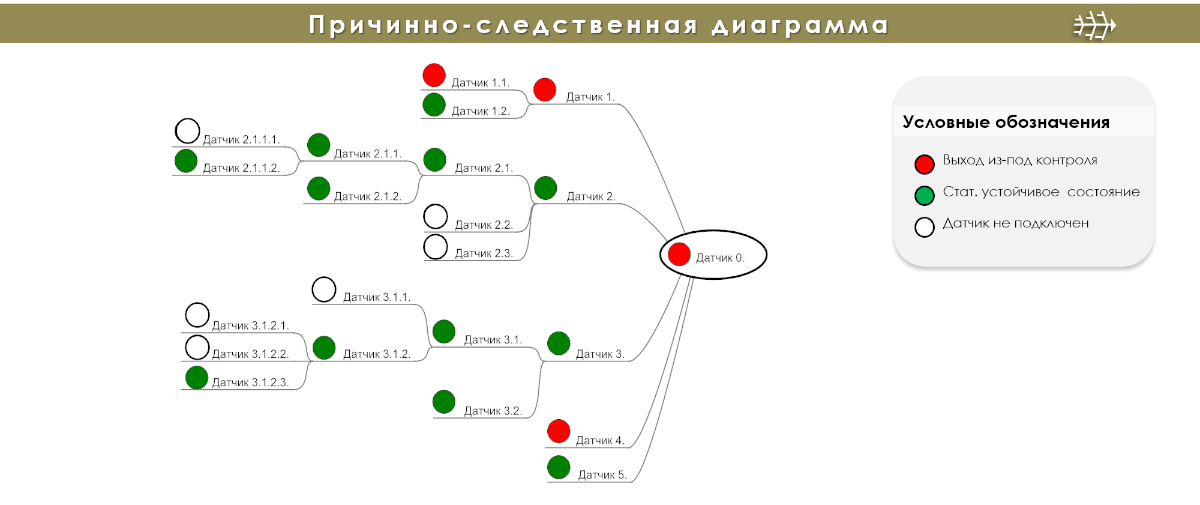
Figure 2. Cause-and-effect relationship of the resulting data from the automated process control system sensors. Points indicating the process exit from a statistically stable state are displayed in red, regardless of the degree to which warning or emergency limits are reached.
The vast majority of automated control systems for technological processes and utility networks (APCS, ASUB, SMUS, ASUiD, Process Control System) used in industry are not equipped with software and analytical modules for statistical process control (Statistical Process Control, SPC), and operator personnel are not trained in these management techniques.
This leads to the fact that operators, in attempts to manage processes, constantly make errors of the first and second kind , not understanding how to distinguish the natural variability of a statistically controlled process (noise) from the unnatural (signal), the latter is caused by the process going out of control under the influence of special reasons.
Properly applied, Shewhart control charts operationally accurately separate noise from signals, revealing the individual signature of equipment and process failures without requiring fictitious boundary values to be set. For example, a problem indicating a lack of such knowledge was reported by OSyS (Optimized Systems and Solutions, a subsidiary of Rolls-Royce), which specializes in providing DSS for monitoring and optimizing high-value assets:
"When analyzing performance parameters, OSyS specialists were faced with the fact that they either had to set the threshold values too narrow, and then the number of alerts would sharply increase, or the values were too wide, and then it turned out that the values in the alert did not meet the required limits. However, technical tools, knowledge and analysis skills helped them create a failure signature for all kinds of data streams that can come from the equipment."
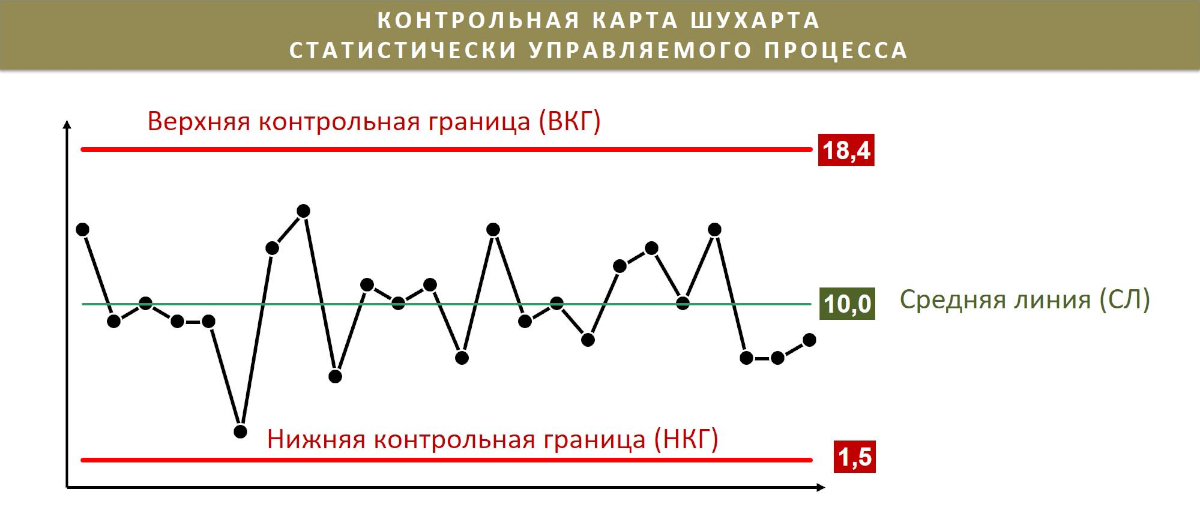
Figure 3. ВКГ and НКГ - upper and lower control limits obtained by calculation from the analysis of historical data of the analyzed process with its inherent variability. Literature: For rules for constructing Shewhart control charts, see GOST R 50779.42-99 (ISO 8258-91) - [11.1] Statistical methods. Shewhart control charts.
An error of the first kind (overregulation), see Figure 4, manifests itself in the form of constant manual or automatic intervention in a process that is in a statistically controlled state, by regulating it in accordance with the rules: 2, 3 and 4 experiments with a funnel, when it reaches emergency limits (limits for the start of regulation, limit values). Essentially it is responding to noise in data as if it were a signal. Points within the limits of a Shewhart control chart are homogeneous and do not differ from each other, despite the apparent difference in the meaning of these data, unless these points extend beyond the control limits or form structures indicating the presence of special causes of variation. The rules for defining such structures in data are often called Western Electric zonal criteria .
Reactive intervention in a process that is in a statistically controlled state (showing no evidence of special causes of variability) by regulating it leads to even greater variability (dispersion of output data around the average value) if the living space of the process allows this or to a distribution of data close to uniform within boundaries of automatic response if the living space of the process is limited by these boundaries, which hides the natural nature of the process from the observer, which means the possibilities for improving such processes are significantly reduced.
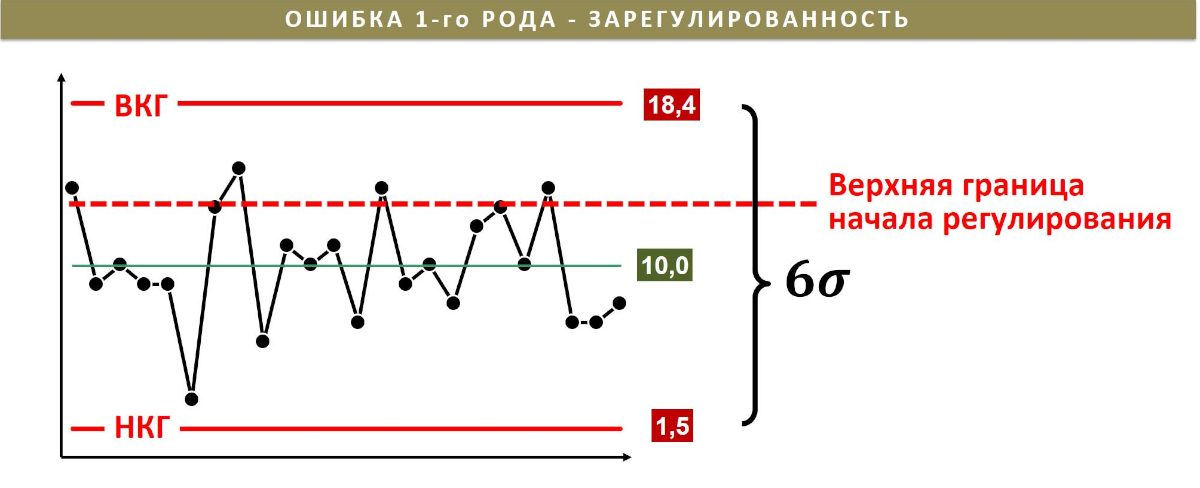
Figure 4. Error of the first type - over-regulation. The limit for the start of regulation by the operator or automation is located within the control limits of the process.
An error of the second type, see Figure 5, consists in the inaction of operators (insufficient control of ongoing processes), when the process leaves the state of statistical controllability (becomes unpredictable), but still has not crossed the maximum tolerance limits established for it emergency limits (limits of the start of regulation, limit quantities). An error of the second type would be any reasoning about the potential capabilities of a process that is in a statistically uncontrollable state.
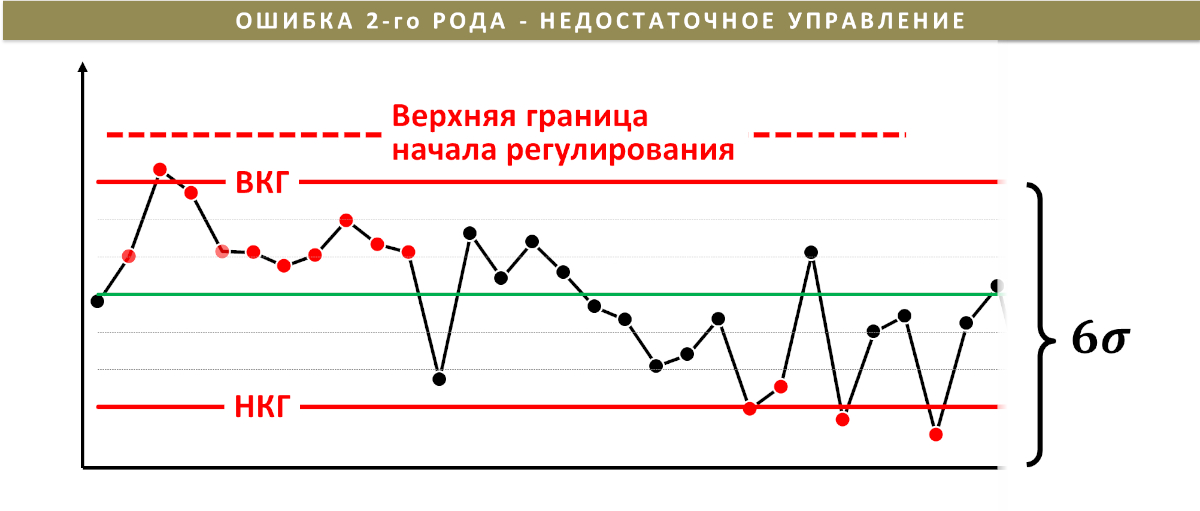
Figure 5. Error of the second type - insufficient control (inaction). The limit for the start of regulation by the operator or automation is located outside (above or below) the control limits of the process. The process is out of control, but no one is reacting to it.
Application of classical automatic control in automated process control systems, PID controllers ( Proportional-integral-derivative controller ), ignores knowledge about the variability of any technological processes, and does not solve the problem of errors of the 1st and 2nd types. The use of such automatic regulators or manual process control can only be effective for processes that are in a statistically uncontrollable state, see Figure 5. But most likely, due to a second type error introduced by the designers of the automated process control system and the lack of necessary knowledge among technologists, the necessary regulation will not be applied until this process reaches the regulation limits.
Not knowing how to minimize the risk of making errors of the first and second types leads to losses and sometimes to serious consequences.
A more down to earth error of the first type is described in the article: The concept of variability and process control , authors Netsvetaev A. G., Rubanik Yu. T., Mikhalchenko V. V.
For operational diagnosis (analysis of statistical controllability, predictability) of a process and taking the necessary measures to it, avoiding errors of the first and second types, “voice” data of any technological process, collected automatically or manually, can be used:
- any key performance indicators, procurement efficiency, sales, design, equipment maintenance, etc.;
- data on incoming C&M control, quality management of suppliers, quality of own semi-finished products and products;
- frequency of events (incidents, incidents), any counting data (defects, breakdowns, unplanned shutdowns, etc.);
- data on size, weight, clearance, flow rate, liquid level, vibration (vibration diagnostics), pressure, temperature, humidity, gas analysis, position, speed, force, viscosity, density, hardness, radioactivity, illumination, dust content, concentration, presence and amount of impurities , tribodiagnostics, acidity, contamination, acoustic measurements, electrical measurements and other measurements.
Chapter [15] of the educational manual “DESIGN OF CONTROL SYSTEMS FOR FLEXIBLE AUTOMATED PRODUCTION” of Tomsk Polytechnic University is devoted to the task of automated control systems in the operational diagnosis of the condition of technological equipment using Shewhart control charts.
Conclusion
Don't ignore the nature of variability. Integrate intelligent methods of statistical process control (Statistical Process Control, SPC) into automated process control systems and automated control systems.