Rules for Determining Lack of Control and Separating Signals from Noise in Shewhart Control Chart Data - "Western Electric Zonal Criteria"
[4] - Donald Wheeler, David Chambers, “Statistical Process Control. Business Optimization Using Shewhart control charts” / “Understanding Statistical Process Control”, Donald J. Wheeler; Per. from English - M.: Alpina Publisher, 2016. Scientific editors Yu. Adler, V. Shper. You can purchase the book from the publisher Alpina Publisher .
Material prepared by: Scientific Director of the AQT Center Sergey P. Grigoryev .
Free access to articles does not in any way diminish the value of the materials contained in them.
These four rules are sometimes called "Western Electric Zonal Criteria".
Rule 1
The exit of at least one point beyond the three-sigma limits (3σ), also known as the upper (UCL) and lower (LCL) control limits, indicated by red lines on the control chart, indicates a lack of controllability.
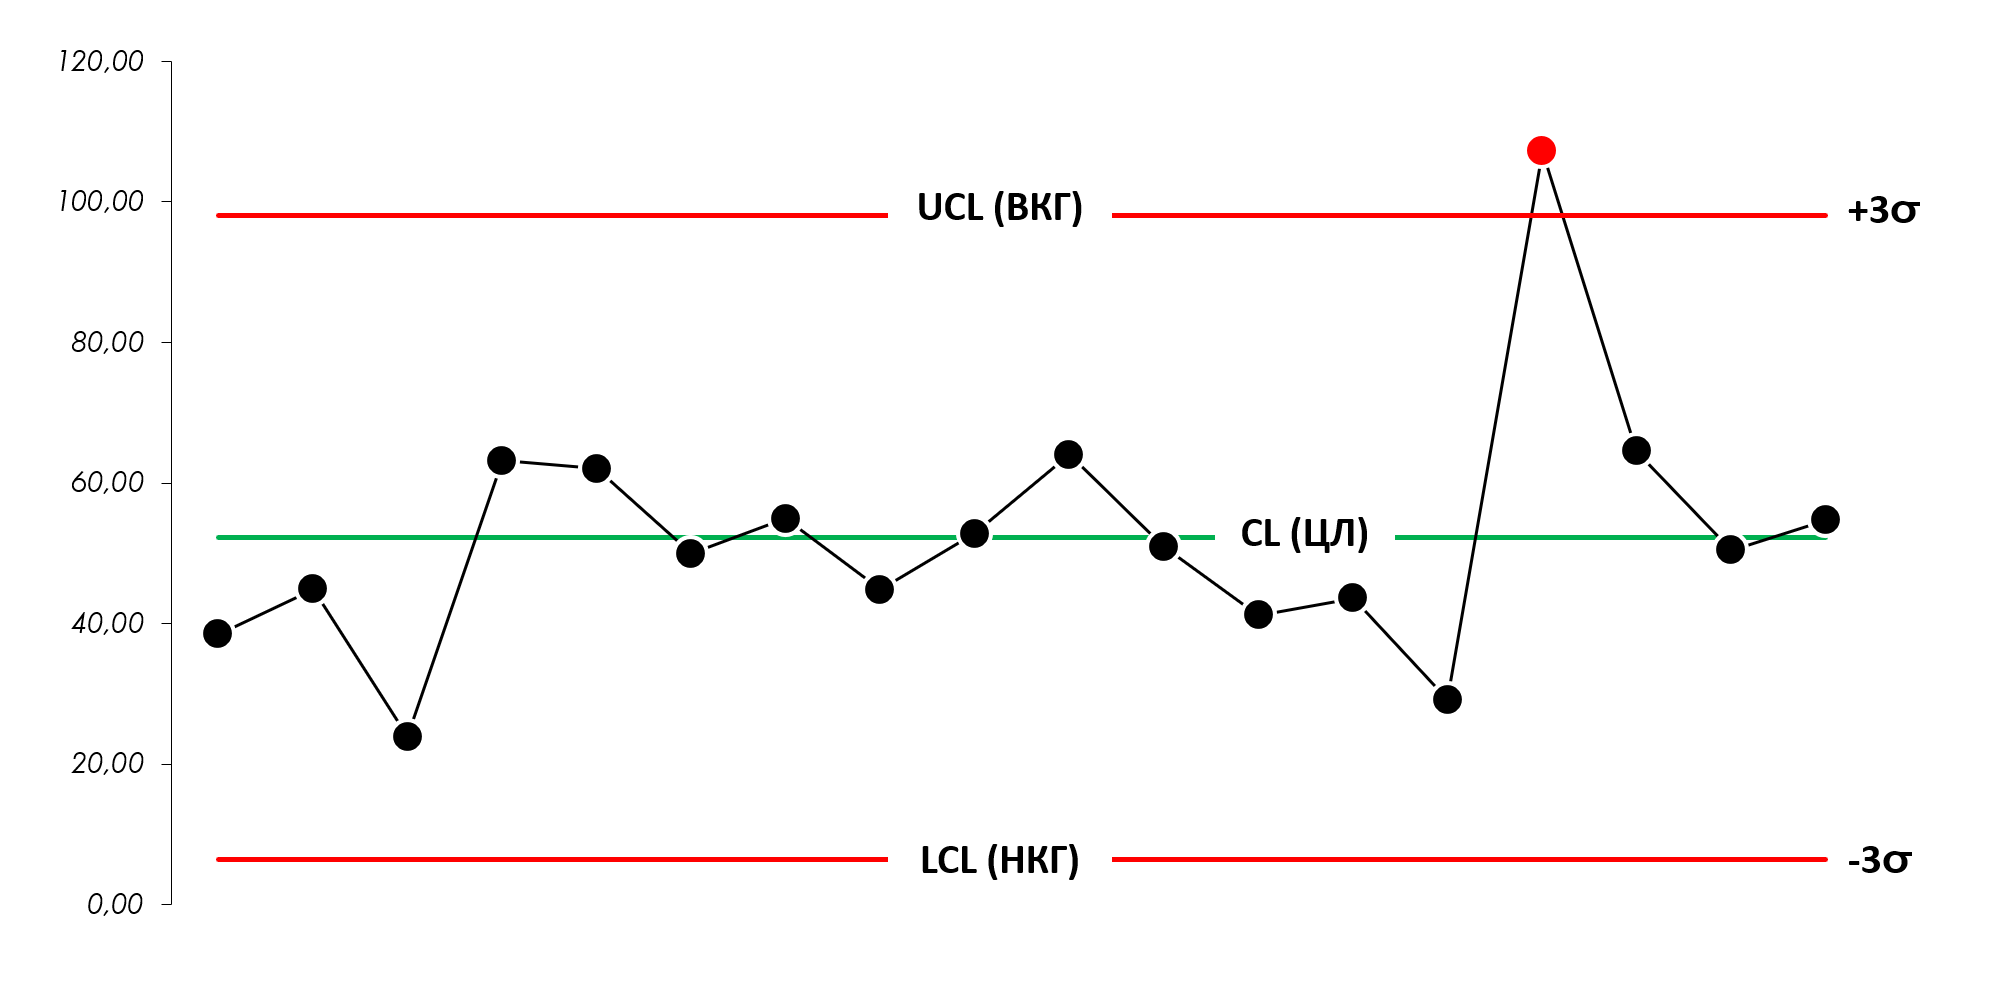
Figure 1. Shewhart control chart. Western Electric Zone Criteria Rule 1.
Rule 2
The exit of at least two of three consecutive points lying on one side of the center line beyond the two-sigma limits (2σ) indicates a lack of controllability. The third value can lie on either side of the center line.
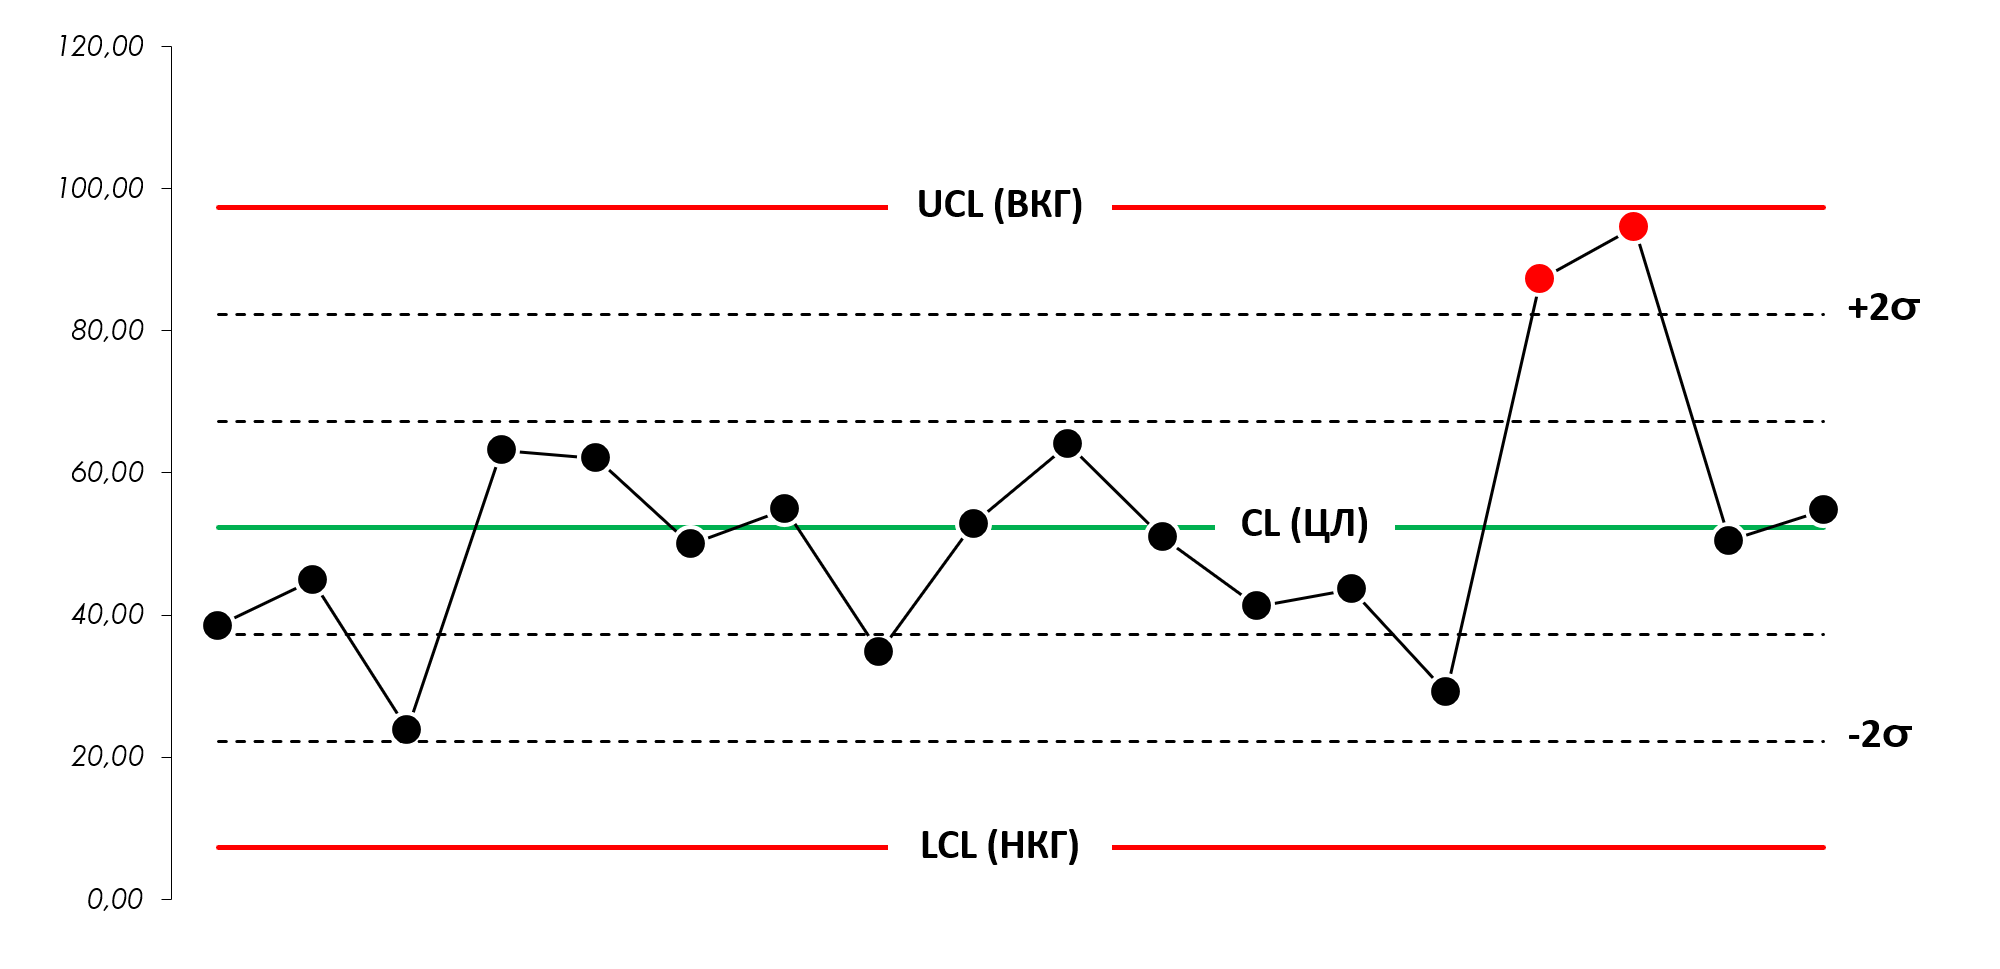
Figure 2. Shewhart control chart. Western Electric Zone Criteria Rule 2.
Rule 3
If at least four of five consecutive points lying on one side of the center line exceed one sigma (1σ), it indicates a lack of controllability. The fifth point can be on any side of the center line.
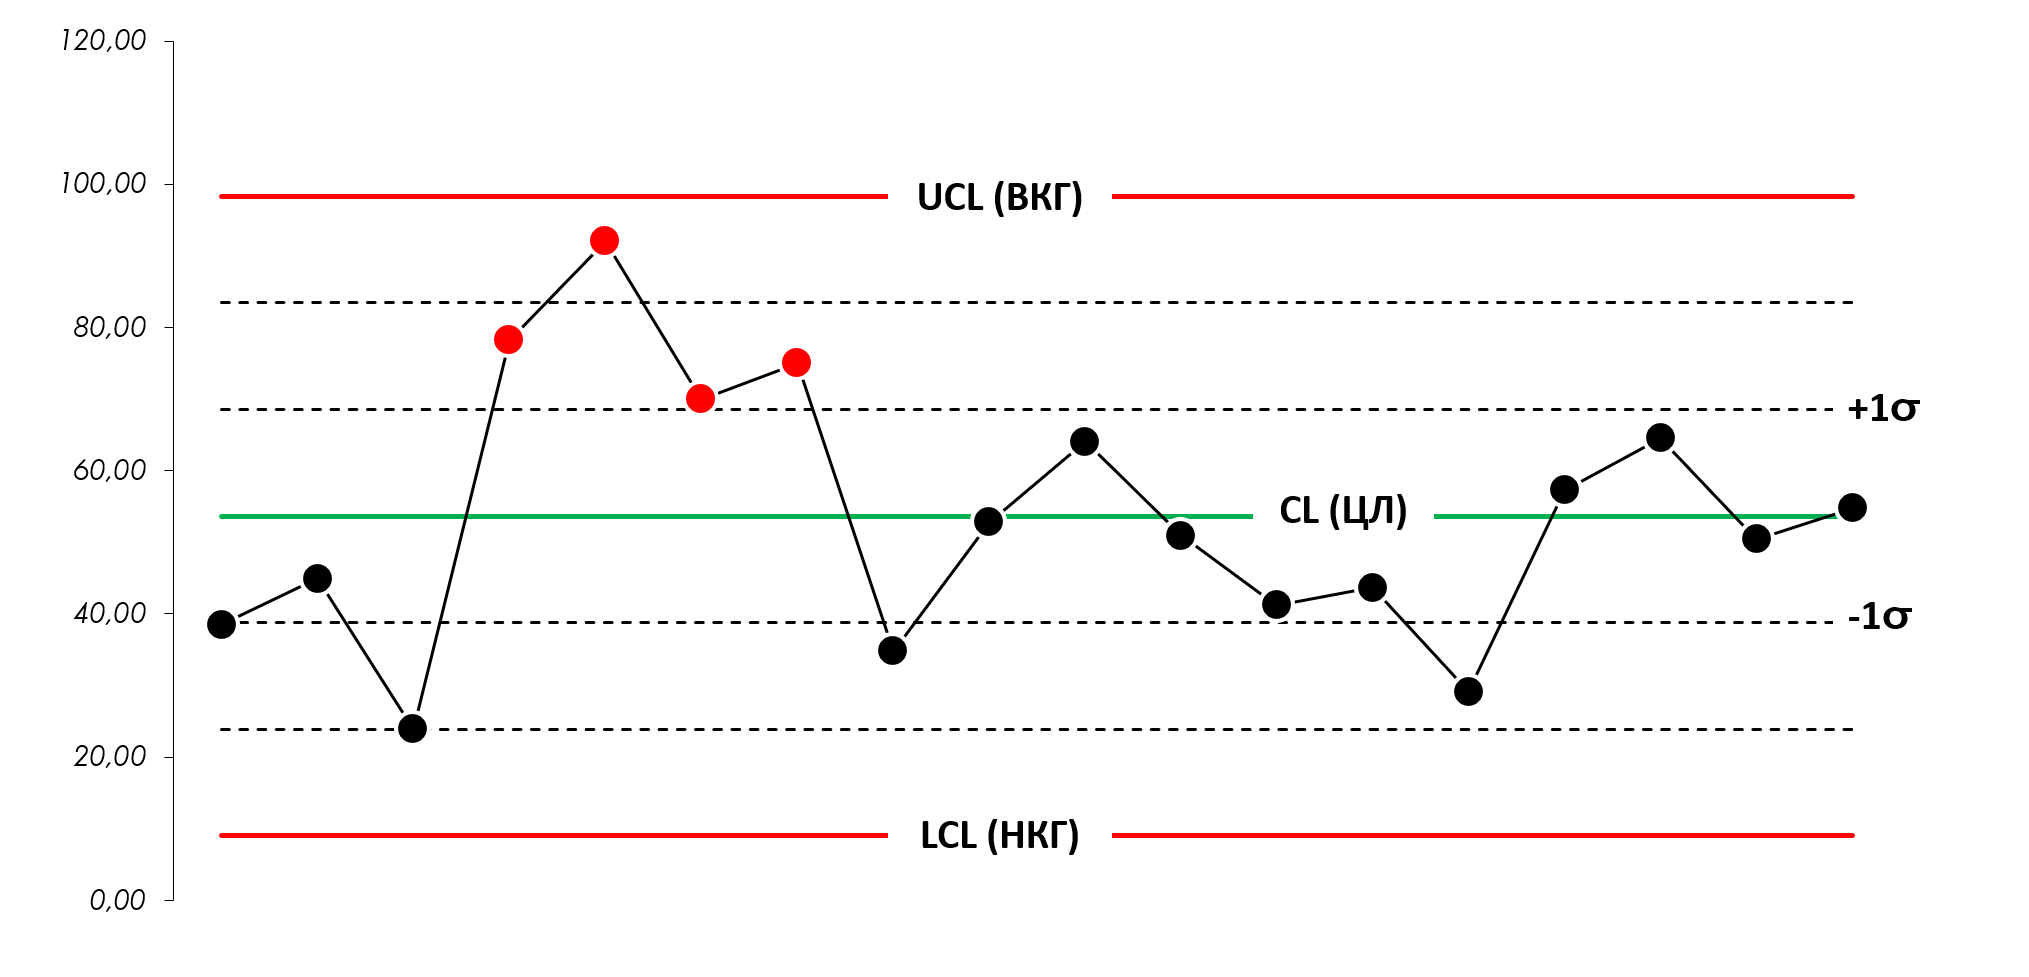
Figure 3. Shewhart control chart. Western Electric Zone Criteria Rule 3.
Rule 4
The location of at least eight consecutive points on one side of the center line indicates a lack of controllability.
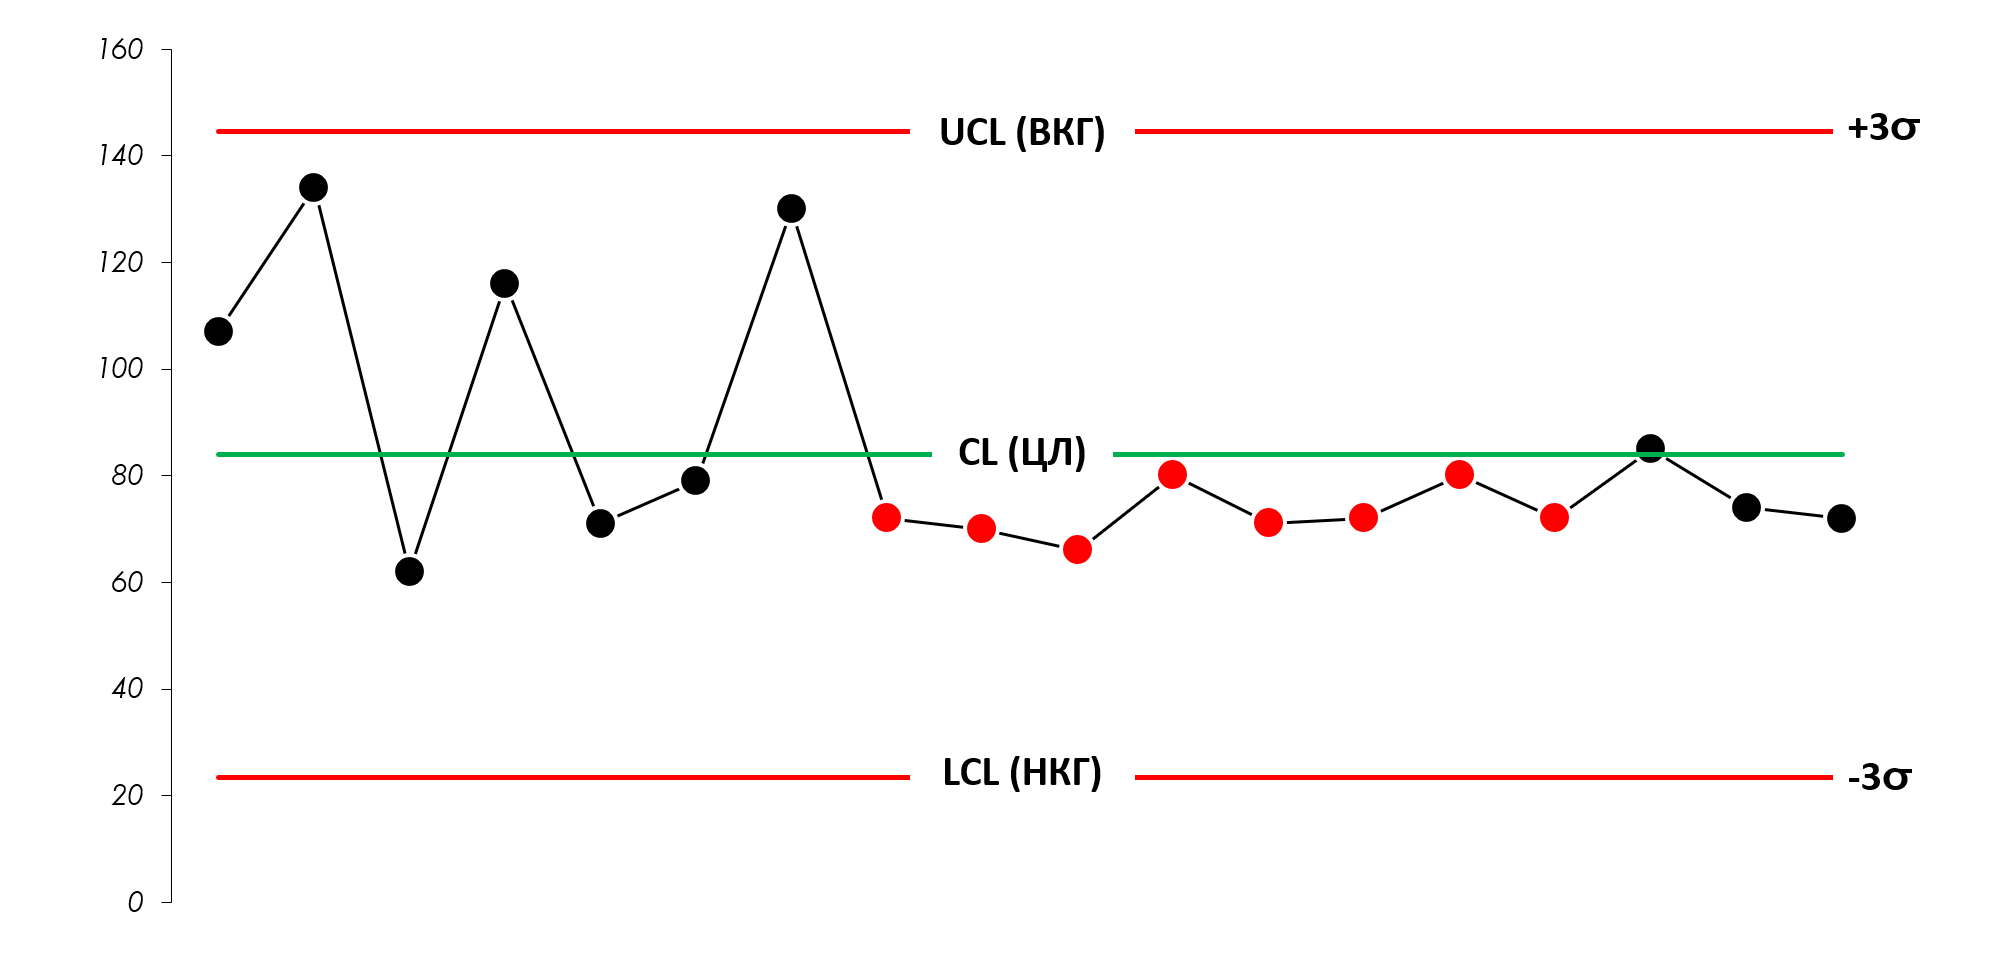
Figure 4. Shewhart control chart. Western Electric's Rule of 4 Zonal Criteria.
Explanation
For series relative to a center line, a new series begins whenever the current data crosses this line. As soon as a certain point falls exactly on the center line, it starts a new series.
In Donald Wheeler's article "When Should You Use Advanced Discovery Rules?" (DONALD J. WHEELER, "When Should We Use Extra Detection Rules?") specifically notes that as detection rules, rules two, three, and four should only be used when the concept of consistency makes sense for your data.
They cannot be used with arbitrary data order. Moreover, due to the nature of the sliding range calculation, detection rules two, three and four should not be used for the sliding ranges of the mR chart of individual values.
When the run test is applied to a range chart (or to a chart of any other measure of dispersion), some assumptions must be made about the lack of symmetry in the range distribution. This lack of symmetry increases the chances of long streaks occurring below the center line. There are two ways to get rid of this problem. The simplest remedy is to carefully interpret the series below the center line on the range map. Indeed, instead of eight points in a row below the center line, 12 may be needed to indicate a special cause. The second remedy works a little better, but is more complicated - using the median of the Me(mR) ranges as the center line. In this case, a series of eight points located either above or below the center line will still indicate a systematic shift in the center line.
We are in software “Shewhart control charts PRO-Analyst +AI (for Windows, Mac, Linux)” To automatically select points on the range map, we use the second “medicine” (a series of eight points located either above or below the median Me(mR) of the ranges).
As you move from rule 1 to rule 4, longer and longer series are needed to detect lack of controllability at points lying relatively close to the center line. These four rules form a complete set of decision rules when identifying a process shift. Unfortunately, not all of these rules are equally easy to apply in practice.
Since rules 1 and 4 do not require any additional calculations, it is advisable to use them first. Then, if greater sensitivity and quick response are required, rules 2 and 3 can be used.
Finally, it is worth keeping in mind that the purpose of using control charts is to gain greater understanding of the process. This means that the main part of identifying the transition of a process to an uncontrollable state is the researcher’s ability to interpret the resulting charts from the point of view of the nature of the process. Without this ability, even a very effective series criterion will be of little value. Therefore, the application of these rules, as well as any other series criteria, always requires caution.
It is also worth noting that each of the series criteria is sensitive to one type of structure. The series criteria presented in this chapter are focused on identifying sustainable shifts. Other series criteria are sensitive to oscillations, although there are also those that are convenient for determining trends.
This list is endless. There are a lot of other methods that could be included. But adding each new lack of controllability criterion increases the likelihood of false alarms. The more criteria are used, the more often something appears that appears to be a signal.
A typical way to characterize a given set of detection rules is to calculate the average run length (ARL) between false alarms. ARL values are theoretical, so they can only serve as a very rough guide for practice. At the same time, they may indicate problems associated with the proliferation of series criteria.
Using Rule 1, the theoretical distance between false alarms in the mean chart is 370 subgroups. If Rule 1 is combined with Rule 4, then ARL = 153. If all four Rules apply simultaneously, then ARL is 92.
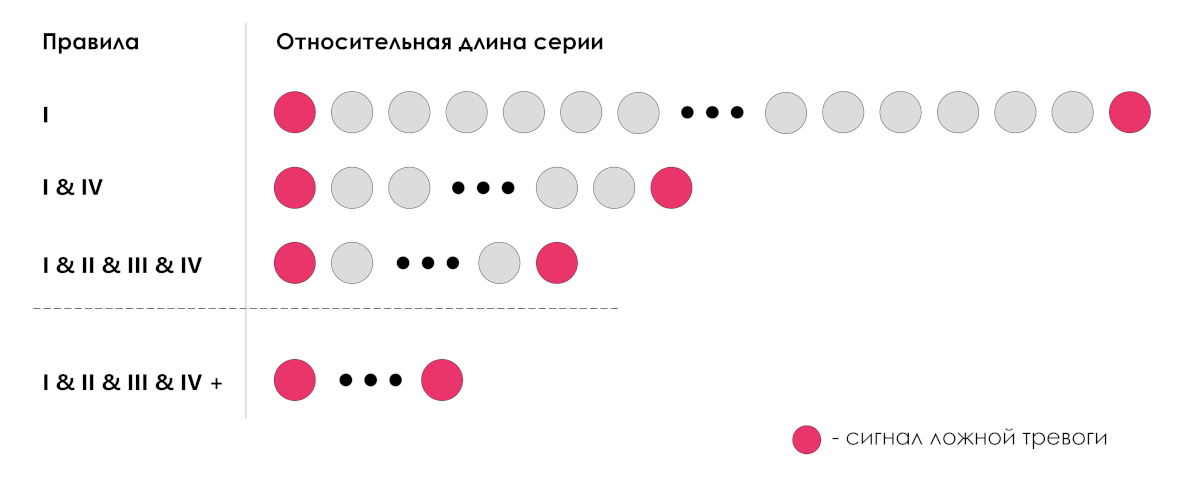
Figure 5. Relative theoretical distance between false alarms (relative run length) on Shewhart control charts.
Although the theoretical value of 92 is quite acceptable, additional criteria will lower it, bringing it to an unacceptably small value. Therefore, while many call for the simultaneous application of more than a dozen criteria, the authors of this book recommend limiting yourself to the rules described in this section.
Uptrend or downtrend
Some books recommend identifying “ascending” and “descending” series in addition to the “central” ones. In the first case, each subsequent value is greater than the previous one, in the second - less. However, some recent studies indicate that the use of such series, firstly, cannot significantly increase the sensitivity of the control card and, secondly, can increase the number of false alarms.
Repeatable data structure
One of the indicators of the constancy of the structure is its eightfold repetition. Attention to structures that relate to the way data is collected and presented cannot be programmed. It rather depends on observation and the ability to understand the nature of the data. This ability has always been, is and will be the basis for the effective use of control charts."
Additional Series Criteria
In Donald Wheeler's article "When Should You Use Additional Discovery Rules?" (DONALD J. WHEELER "When Should We Use Extra Detection Rules?"), kindly provided to us, describes some additional criteria for increasing the sensitivity of control charts that can be used during the initial setup of a control chart, but are of little use when control charts are used in production environment. We publish some of these rules in this article.
In 1984 and 1985, Lloyd Nelson at Nashua Corp. gave a list of eight rules for detecting special causes of variability.
Nelson's seventh rule
Nelson's seventh rule is designed to "span the center line" - fifteen points in a row, all points within one sigma of the center line.
Most often this is the result of stratification of subgroups, where each subgroup contains data from two or more different production processes. Although this phenomenon can be found in Xbar charts of subgroup means, it often appears first in the R chart of group ranges. (Because this rule looks for stratified subgroups, it is not suitable for use with an XmR chart where the subgroup size is one.)
This rule is one of Western Electric's pattern discovery guidelines, which can be useful in the initial stages of creating control charts of subgroup averages and ranges. While cautioning that the subgrouping applied may be irrational , this can help avoid creating a useless control chart.
However, once the subgroups are organized in a rational manner, this rule has little effect during production. Nelson did not include this rule in his list of rules for everyday use.
Recommendation: We agree with Nelson that the seventh rule is useful when initially setting up an XbarR control chart of subgroup means and group ranges, but is of little use when the chart is used in a production environment.
Figure 6 shows an example of a control XbarR-chart of means and ranges of subgroups, a histogram and a scatter plot, built in our “Shewhart control charts PRO-Analyst +AI (for Windows, Mac, Linux)” for data combined into non-rational subgroups:
Notice how the histogram and especially the scatter plot (below the histogram) show three different streams of this data (from three processes) in Figure 6.
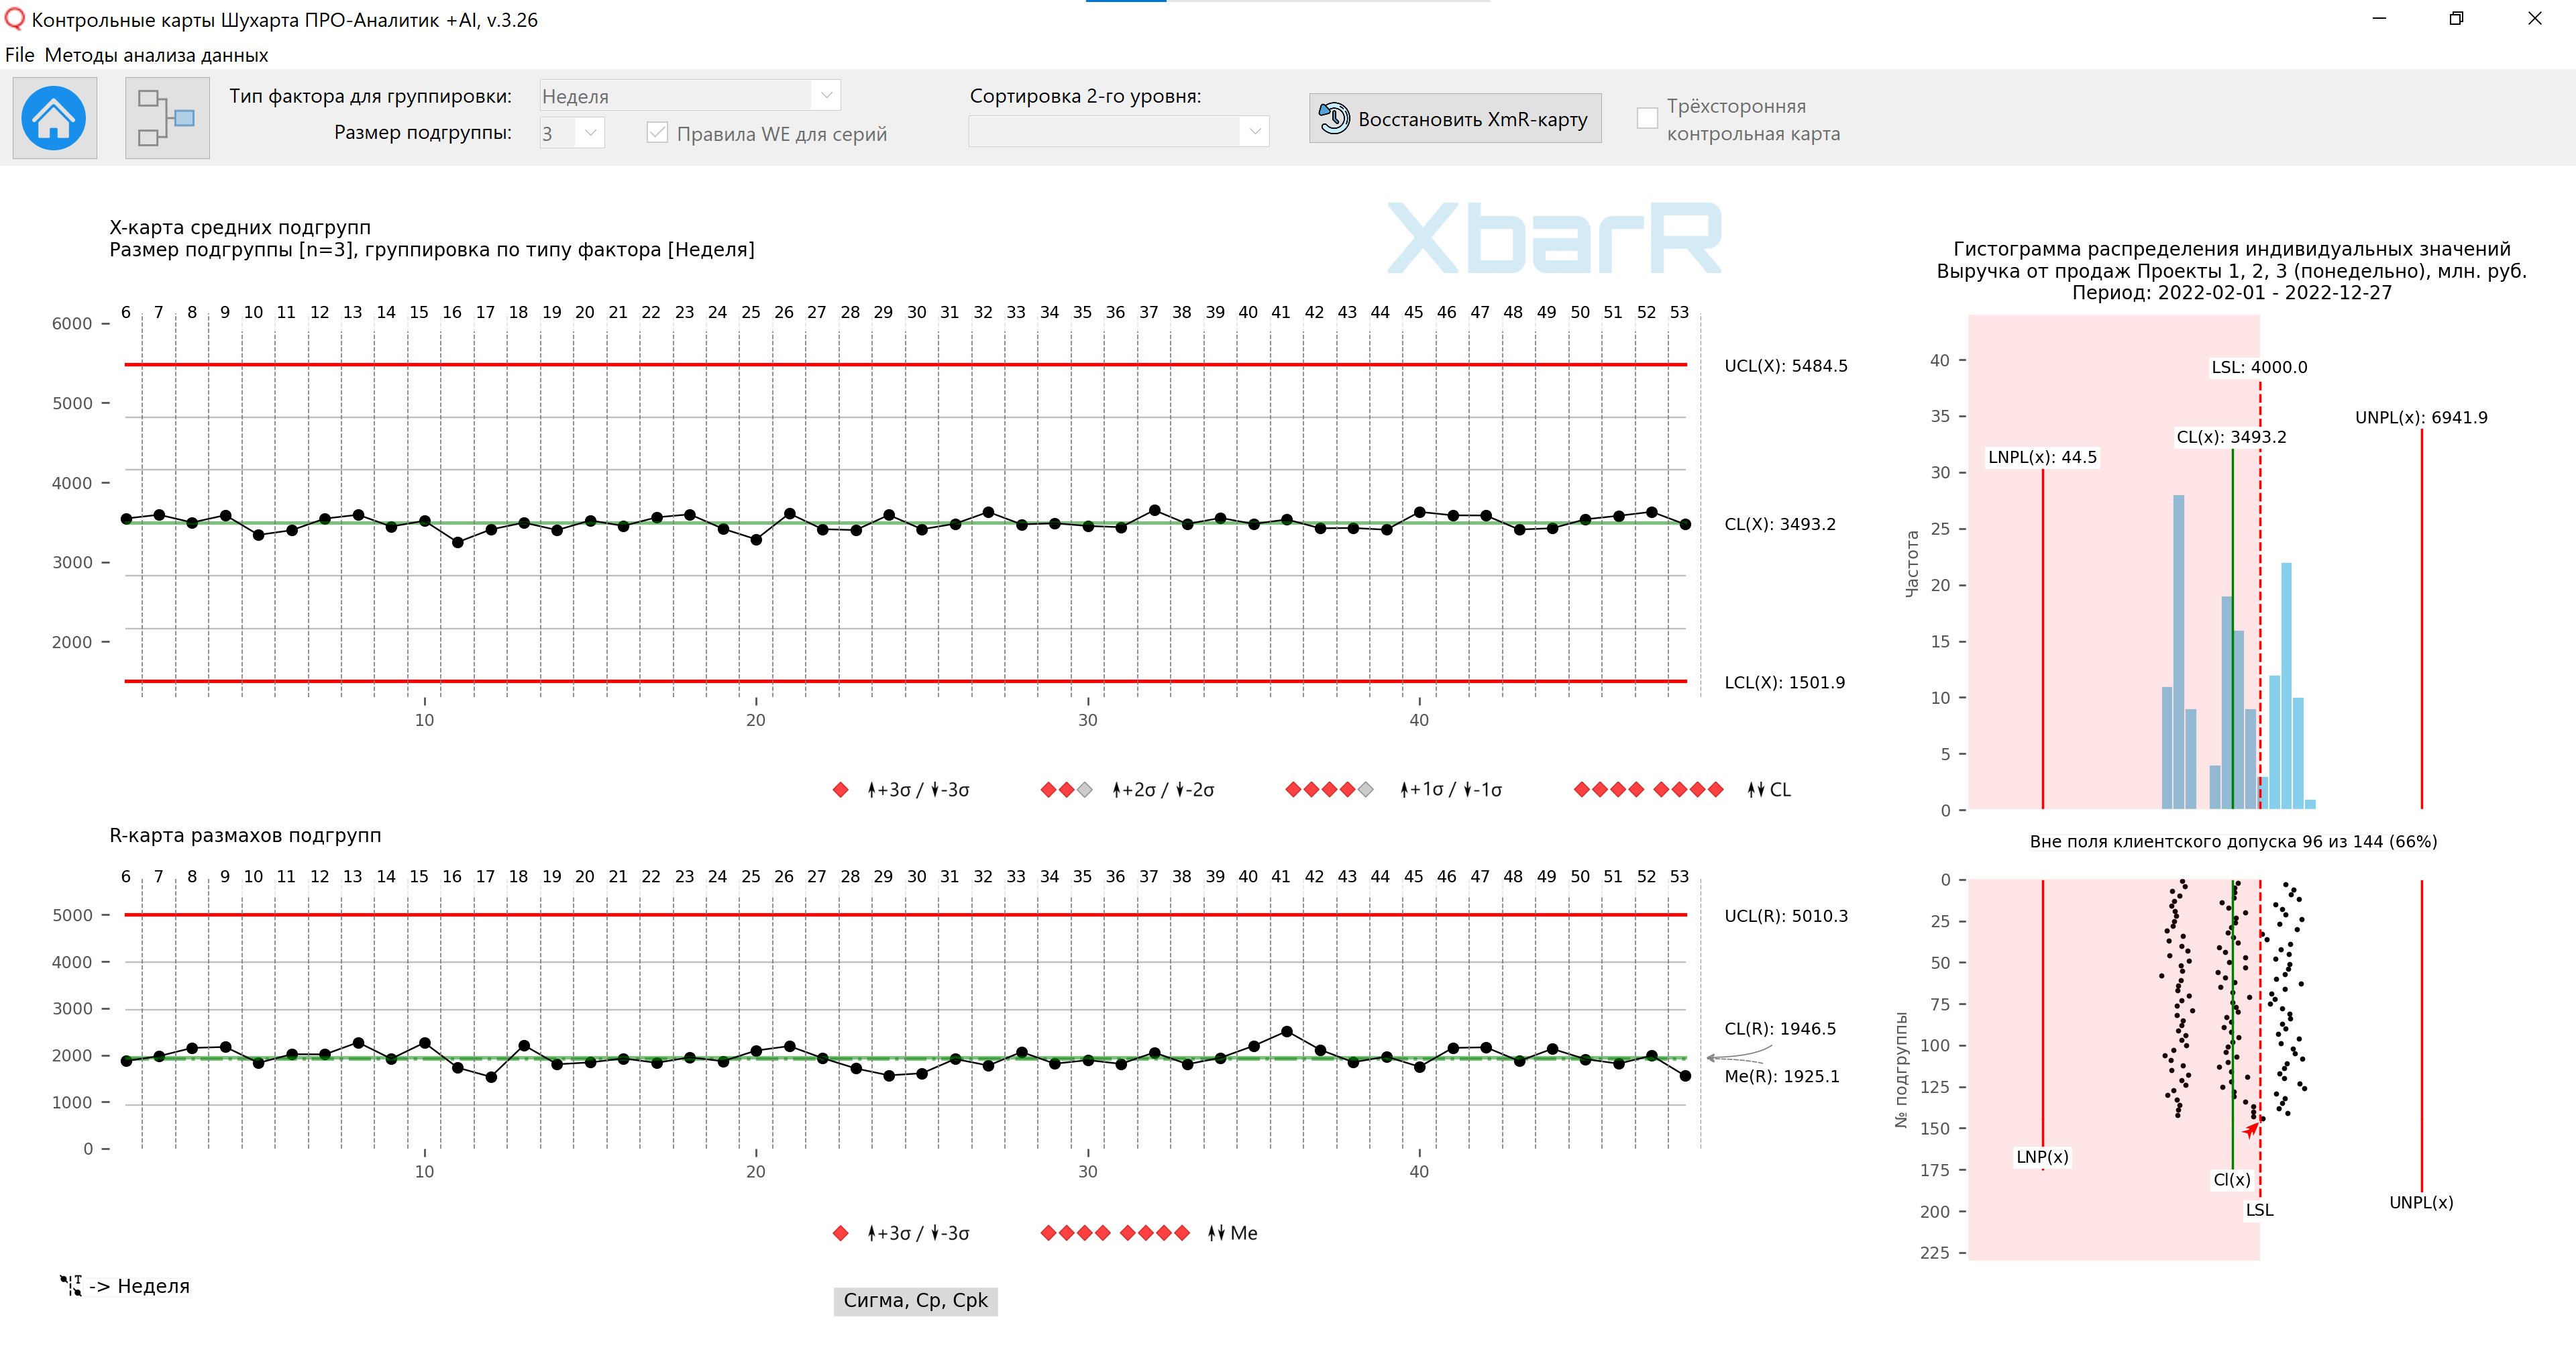
Figure 6. Control XbarR-chart of subgroup means and ranges for irrational grouping of data in subgroups. The drawing was prepared using our developed “Shewhart control charts PRO-Analyst +AI (for Windows, Mac, Linux)” using a unique data grouping automation functions to construct an XbarR-chart of the means and ranges of subgroups by the selected type of sources of variation (column with factors) and the size of the subgroups.
In contrast to the irrational grouping of the data in Figure 6, a rational grouping of the same data could take the form presented in Figure 7.
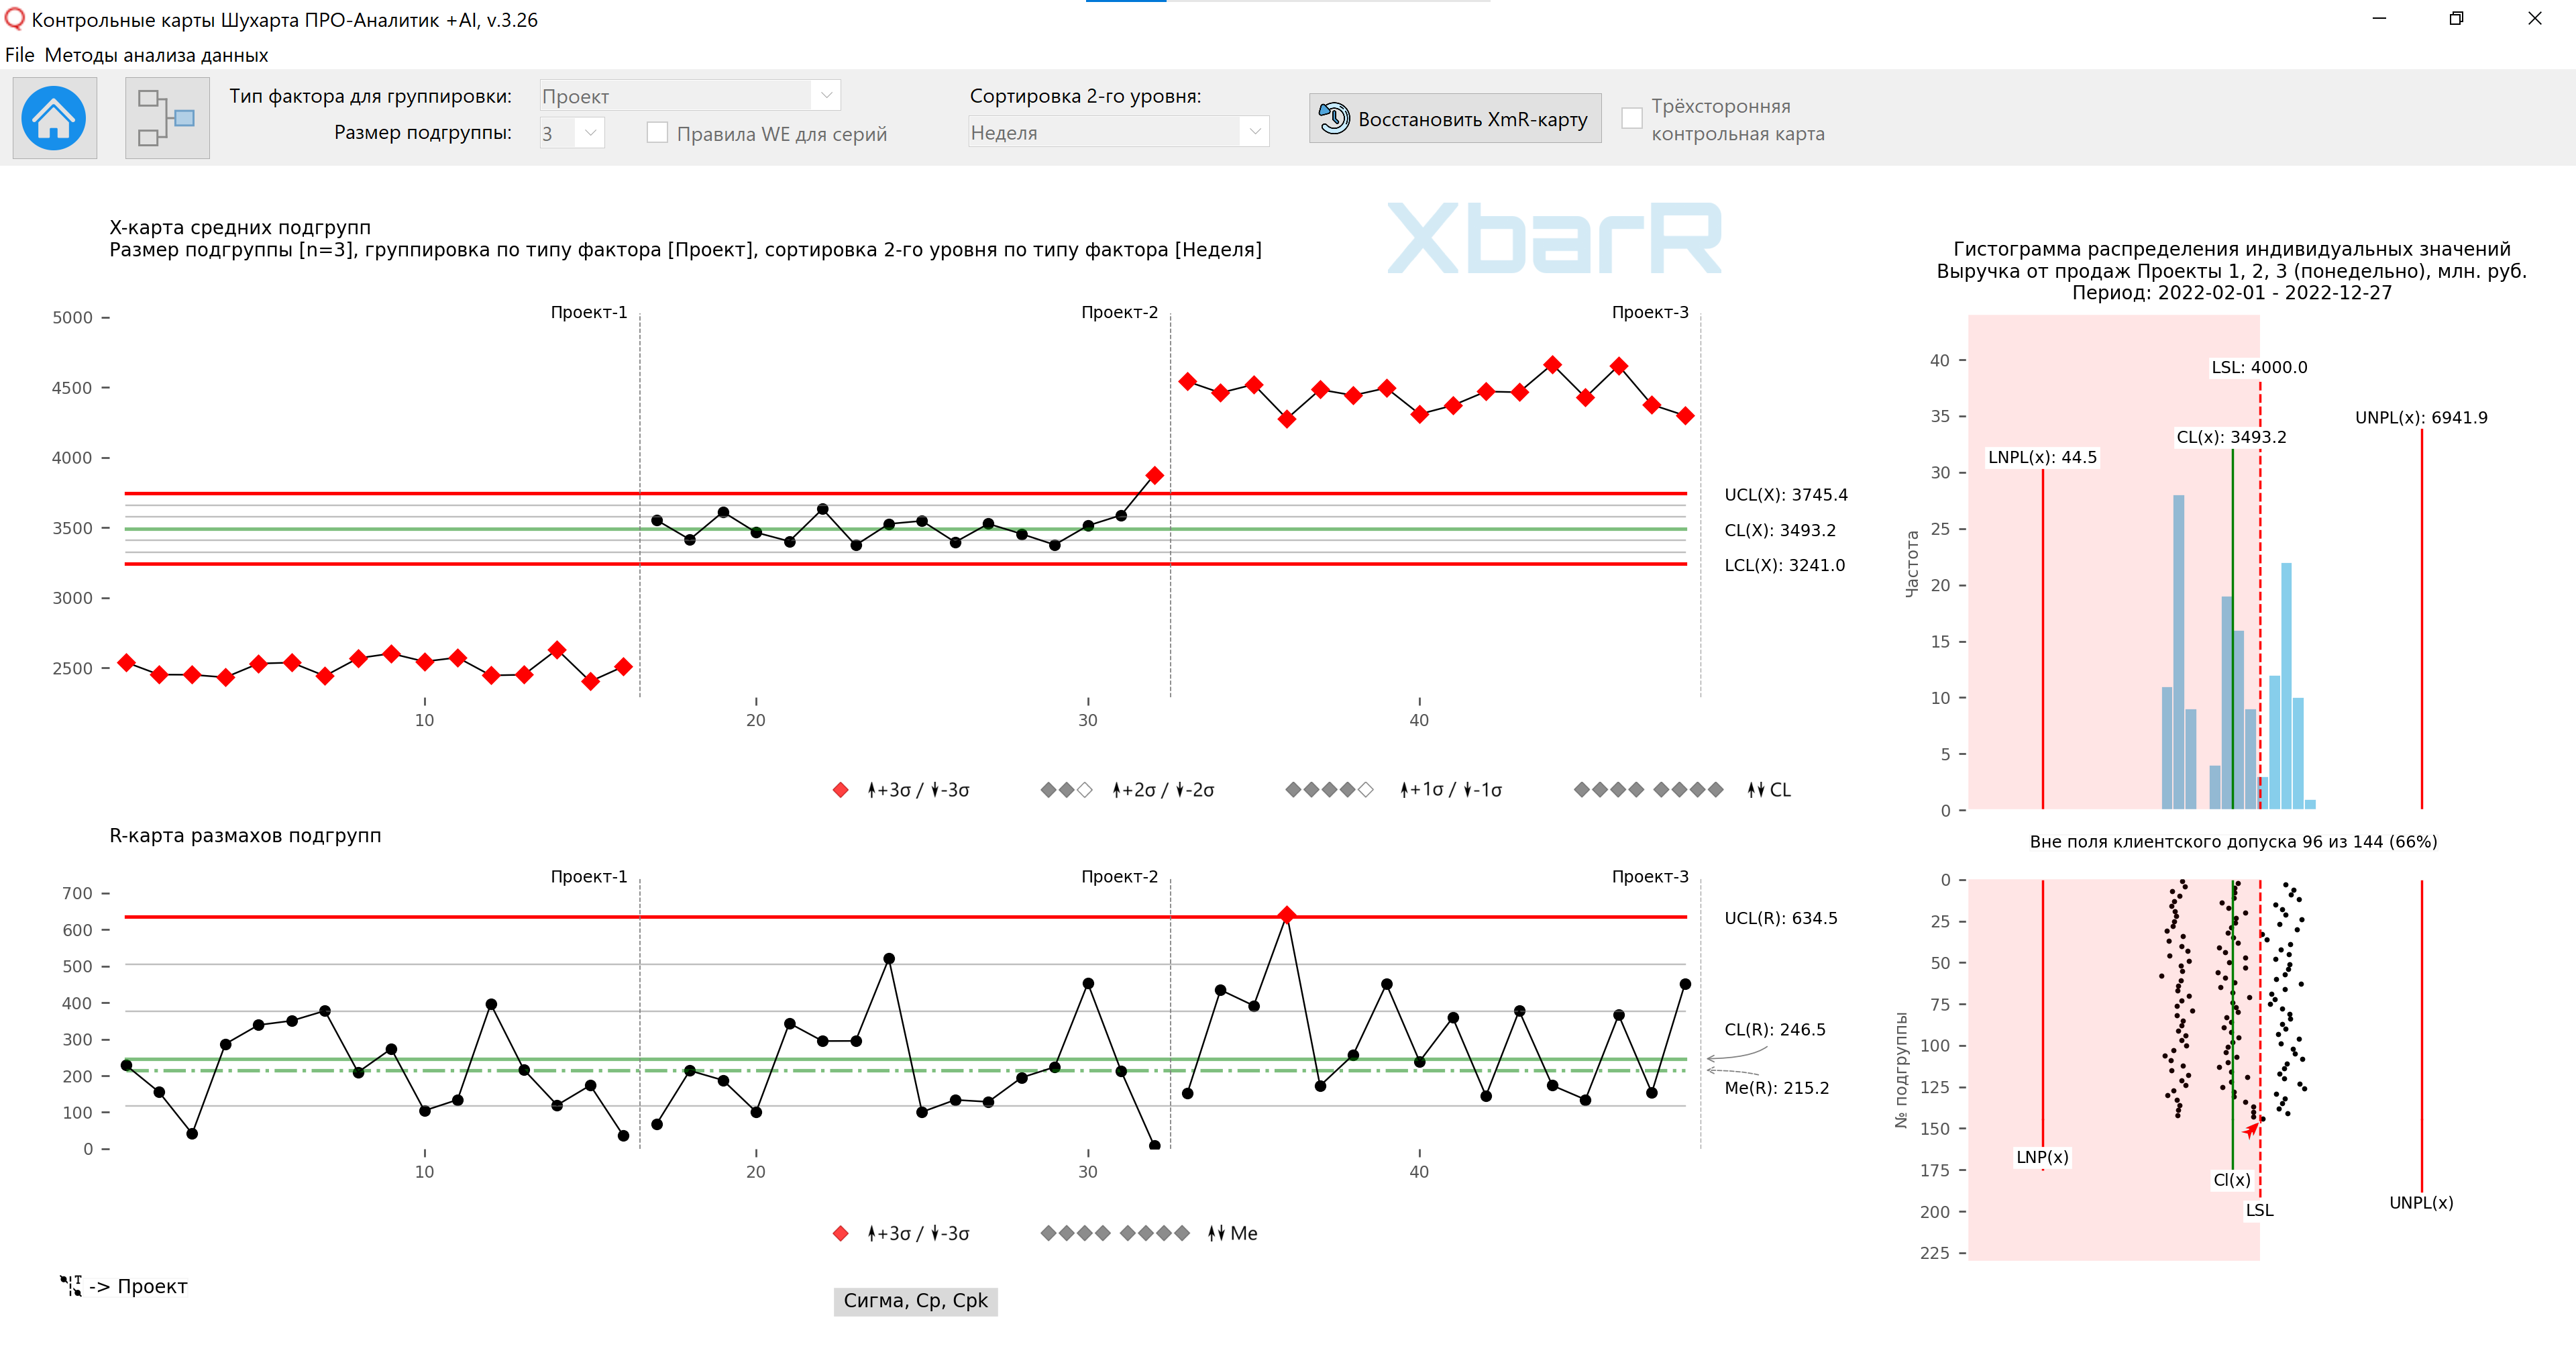
Figure 7. Control XbarR-chart of subgroup means and ranges for rational grouping of data in subgroups. The drawing was prepared using our developed “Shewhart control charts PRO-Analyst +AI (for Windows, Mac, Linux)” using a unique data grouping automation functions to construct an XbarR-chart of the means and ranges of subgroups by the selected type of sources of variation (column with factors) and the size of the subgroups.
Then you can apply the construction function to the data in Figure 7 with rational grouping of data in subgroups control limits for individual batches , see Figure 8.
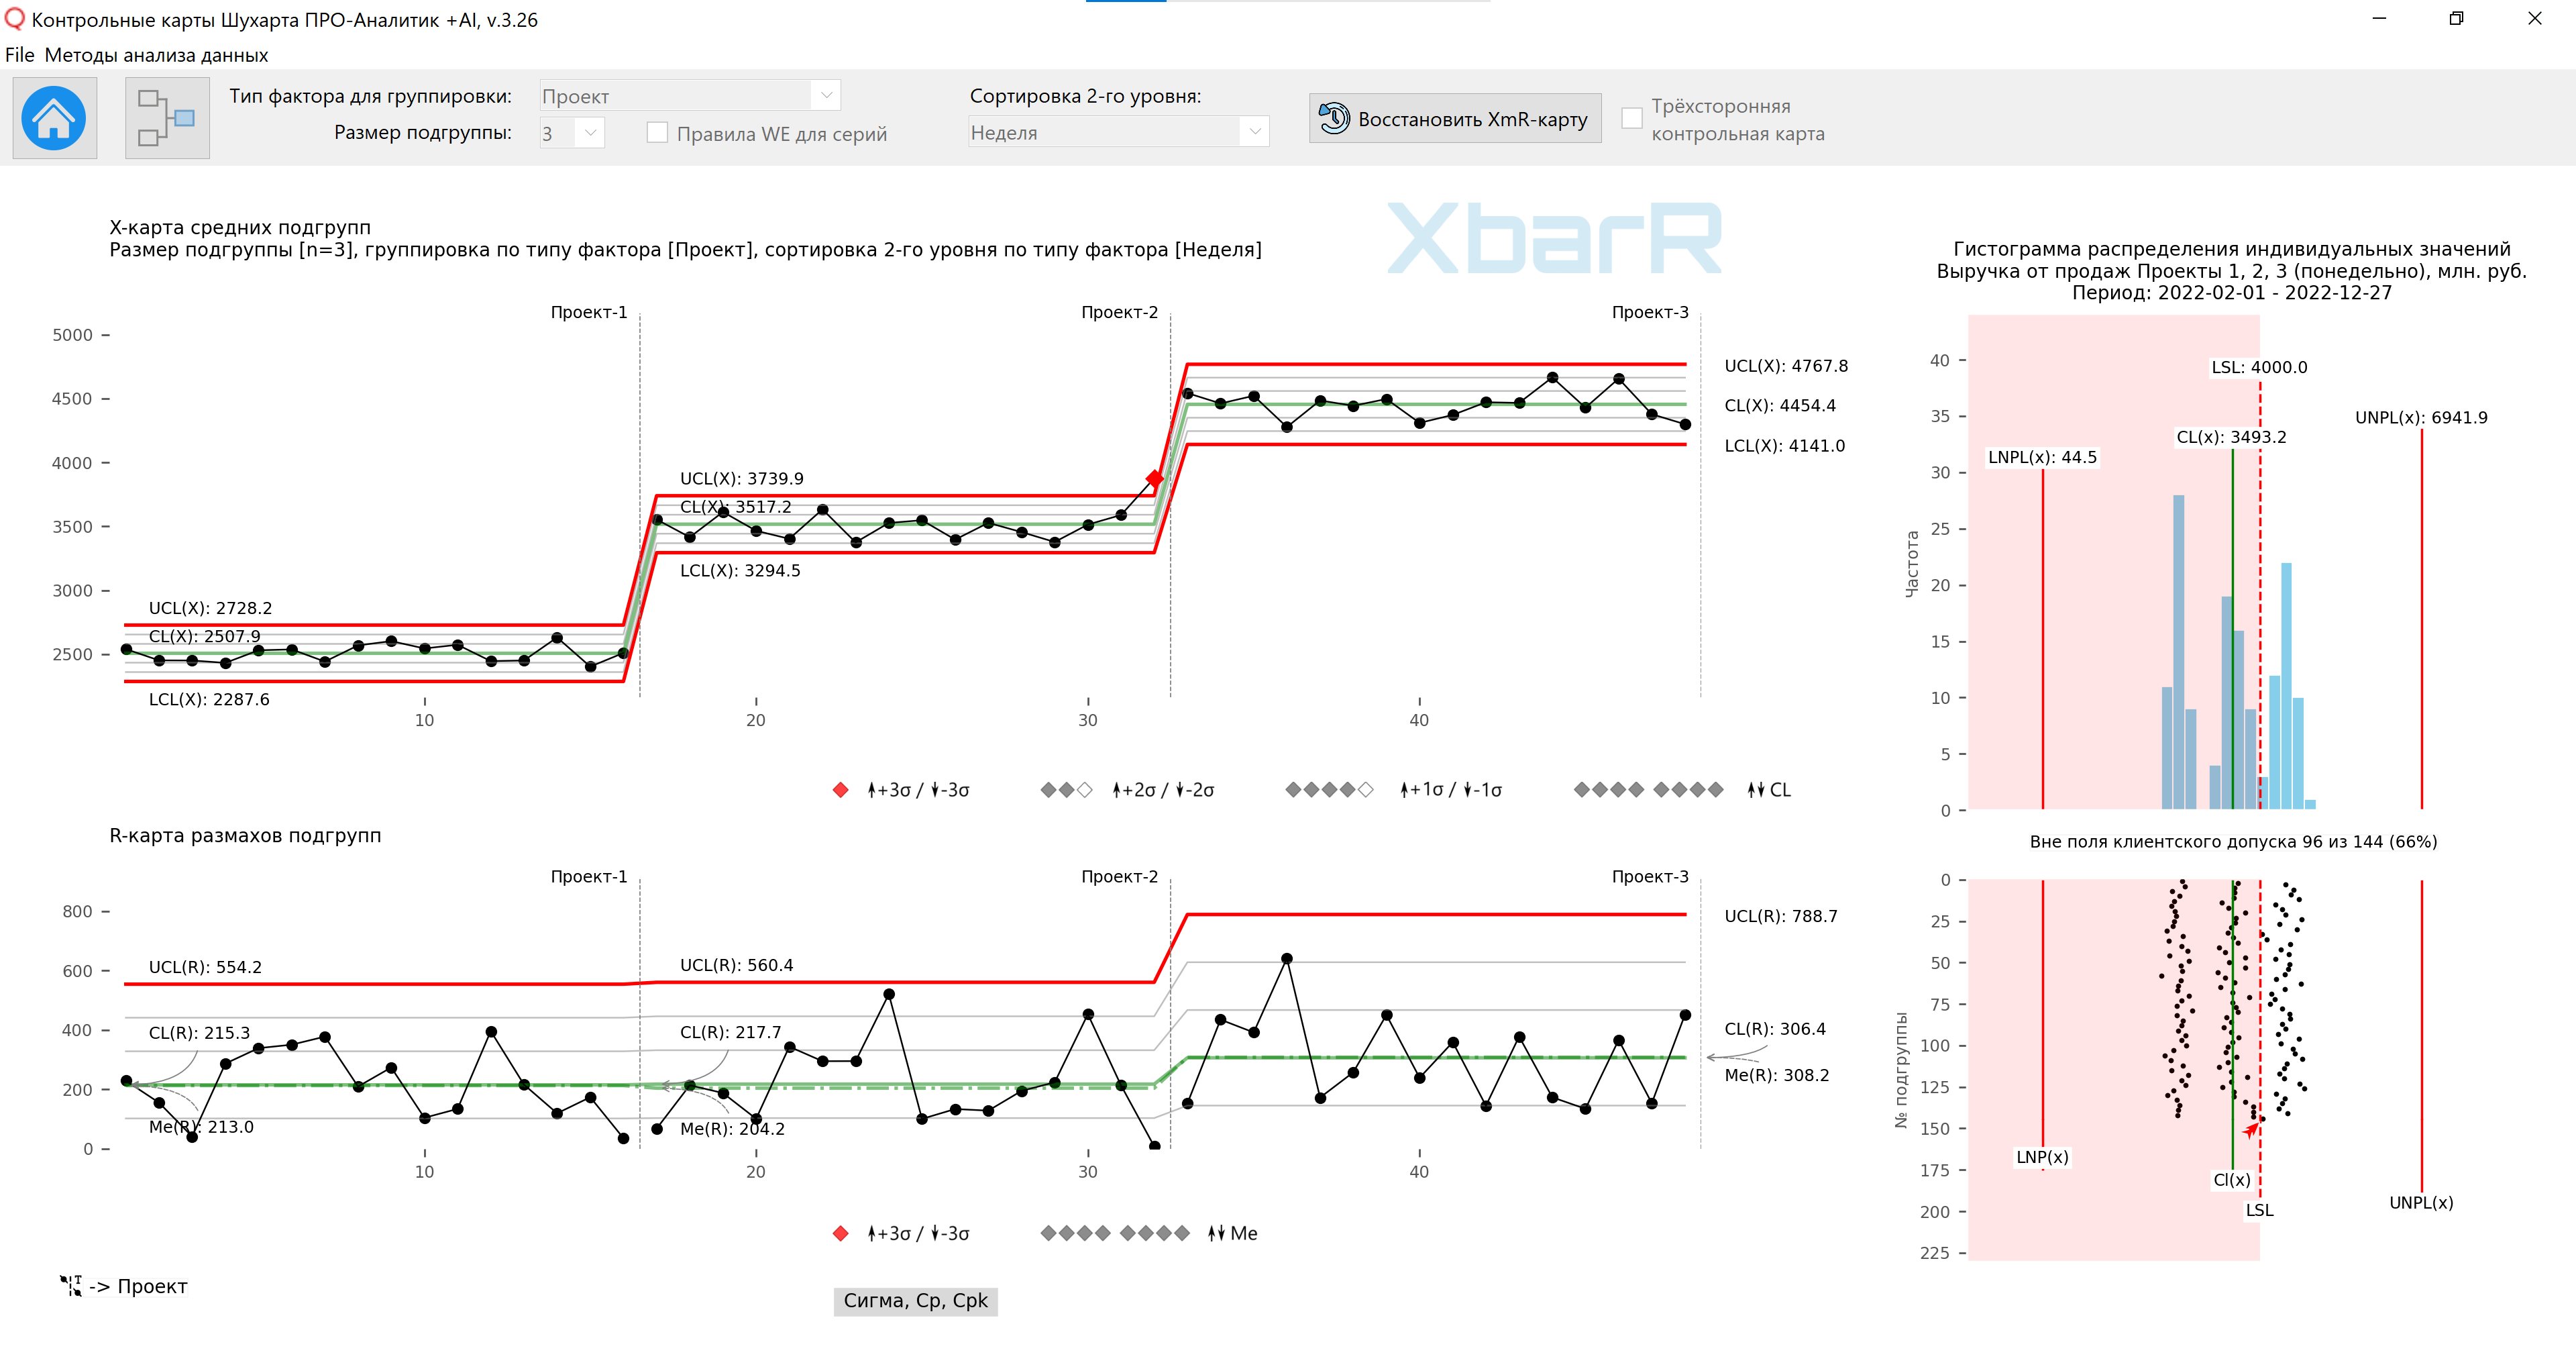
Figure 8. XbarR control chart of subgroup means and ranges for rational grouping of data. Control limits were constructed for individual series of subgroups.