When designing in CAD, do you rely on testing a digital model built at face value? Then expect problems with the assembly of components and the behavior of the finished product in real conditions
Material prepared by: Scientific Director of the AQT Center Sergey P. Grigoryev
Free access to articles does not in any way diminish the value of the materials contained in them.
Analysis of variability in production processes will help reduce the negative impact inevitable variations on the dimensional quality of the product, its cost and time to market.
Below is evidence of widespread sub-optimization on the digital model itself, without taking into account the goals that the digital model was supposed to serve.
Our team spoke at a meeting at a Russian research and production corporation with a report on the need to understand the capabilities of real production processes in terms of the variability of key quality indicators in the design and production of products.
One of the sections of the report was devoted to problems with the quality of designed products without understanding the statistical state and capabilities of real production processes, both our own and those of suppliers. In particular, the deputy general designer (ZGK) of one of the enterprises of this corporation reported that the construction of a new data center (data storage and processing center) will reduce full-scale testing.
Our attitude to the ZGK statement: As long as you do not know the possibilities of real processes, we recommend that you beware of such statements. Even a full-scale prototype (prototype) is not a serial product.
"Inadequate testing of prototypes.
The prototype is single, its parameters are artificially close to the nominal ones. Without knowledge of variations, variability cannot be predicted."
When you think about replacing full-scale testing with digital model testing, you must understand what and how much you are willing to neglect. Simply put, you must understand how different the test results of a digital model will be from full-scale tests of experimental models, and even more so from serial products. Assuming the insignificance of the influence of factors that you are willing to ignore, you must understand that the resultant of these and unaccounted for (ignored, undifferentiated and/or numerically immeasurable) factors, taking into account their inherent variability, can significantly, from the point of view of the purpose of the tests, exceed your assumptions. Do you think this is not true? How do you know this? What data do you have to make such conclusions?
Let me give you an example that is world famous.
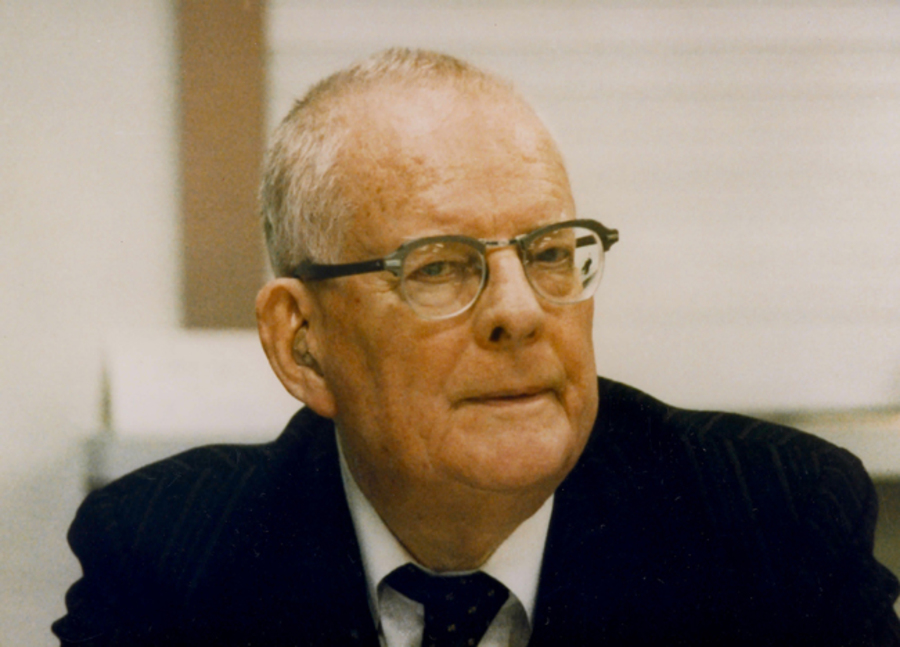
During World War II, the command of the American and British Air Forces assigned Abraham Wald, who worked in the secret program of the Statistical Research Group (SRG), USA, to find out which parts of the aircraft fuselage needed to be protected with additional armor. The military proposed installing additional protection on those parts of the aircraft that suffered the most during air battles. Wald studied planes returning from combat missions, noting the locations of hits. As a result, he recommended installing additional protection in those areas (central and rear parts of the fuselage) where the number of holes, on the contrary, was minimal. The recommendation was based on the conclusion that it was necessary to protect against hits that Wald did not see - the planes that received them simply did not return. Subsequently, decisions made based on the analysis of only known data were called “Survivorship bias.”
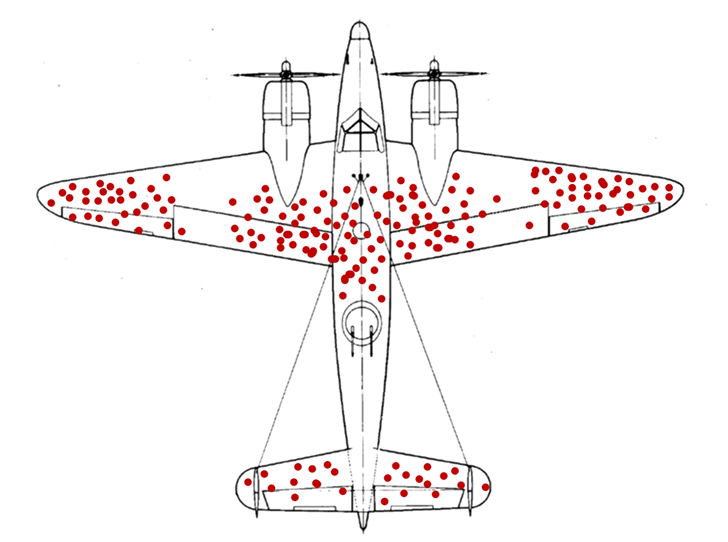
Figure 1. Abraham Wald. Survivorship bias. An airplane with red dots representing the statistics of bullet holes on returning American airplanes.
If you expect to subsequently compare the results of the digital model with tests of real prototypes, then how many prototypes do you plan to produce and test for this: 1; 5; 8; 25? Will these prototypes be the same? How do you know this? To claim homogeneity of prototypes, you must have evidence of the statistical controllability of your own manufacturing processes and the manufacturing processes of the suppliers involved in the production of the prototypes. Can you demonstrate Shewhart's control charts of these processes for all key parameters?
Explanation of our statement
Design in computer-aided design systems (CAD) carried out in nominal terms, a digital model, is not what will happen in hardware. Designers must use data on the inherent variability of real-world manufacturing processes to decide on changes in design, materials, technology, tolerances as necessary, or to require manufacturing departments and suppliers to improve processes and technology before production of the actual prototype begins.
We carefully studied the open corporate publication of a key manufacturing company of this corporation. In the publication, the company's employees reported in sufficient detail about the problems they encounter in production.
In particular, the process engineer of the assembly shop reported:
“The technologist has to look for the optimal solution to a problem that arises during the assembly process, so he is forced to quickly respond to the current situation. Considering that several emergency situations may arise, he has to rush and keep up with everything. This is the normal pace of work for a process engineer in the assembly shop.”
This technologist is so accustomed to the constant occurrence of emergency situations when assembling products that he himself recognizes this as normal. Thus confirming the persistence (stability) of problems during assembly. And stability is a sign of systemic problems. Dealing with systemic problems is the responsibility of management, not the technologist.
The blacksmith said the following:
“When a blacksmith heats a workpiece in a forge, he visually determines the temperature and feels the readiness of the metal for forging. When heated, carbon and other alloying elements burn out of it, so it is important not to overheat. For example, beginners achieve the desired shape from the metal in four heatings; an experienced blacksmith needs only two".
Did the designers take into account this uncertainty of the production process? Does anyone know what kind of alloy is obtained after an indefinite amount of heating to a temperature determined “by eye” by different blacksmiths under different conditions? In this case, will automated calculations of the strength of a digital model help predict the mechanical properties and, for example, the corrosion resistance of real products?!
"Practice is more precise than pure science; more precise than training. According to Shewhart, the standards of knowledge and skill required in manufacturing and service industries are stricter than those of pure science."
The Edwards Deming quote above partly explains the current situation where Russian science confidently withstands competition at the international level, while Russian industry is losing in many areas.
We have given other examples that demonstrate the enterprise management’s lack of understanding of its responsibility for quality, which I do not publish in this article.
I hope it is now becoming clearer how different a digital model, built from parts with nominal tolerances and alloys with the requirements laid down during the design, can differ from a real prototype. If we are talking about serial products, then these differences will be even greater. Given the existence of barriers between departments involved in design, production, supply and work with suppliers, refusal to full-scale testing of products with hundreds and even thousands of parts will lead to huge losses, the true reasons for which will never be recognized by the management of this corporation.

Figure 2. Digital versus natural model.
Next, we invited those present at the meeting to consider options for the simplest two-dimensional pairing of the tolerance fields of the shaft and the hole in the clearance fit. The variability of the geometric dimensions of real parts is the least that distinguishes a digital model from a full-scale one.
Below is a conditional display of the pairing of the tolerance fields of the shaft and hole. Designers will create parts in CAD at par. In the best cases (in the most advanced Russian companies), the digital model will be checked for the combination of tolerance fields of interacting parts and compliance with the dependent tolerance field that is obtained as a result of their interaction.
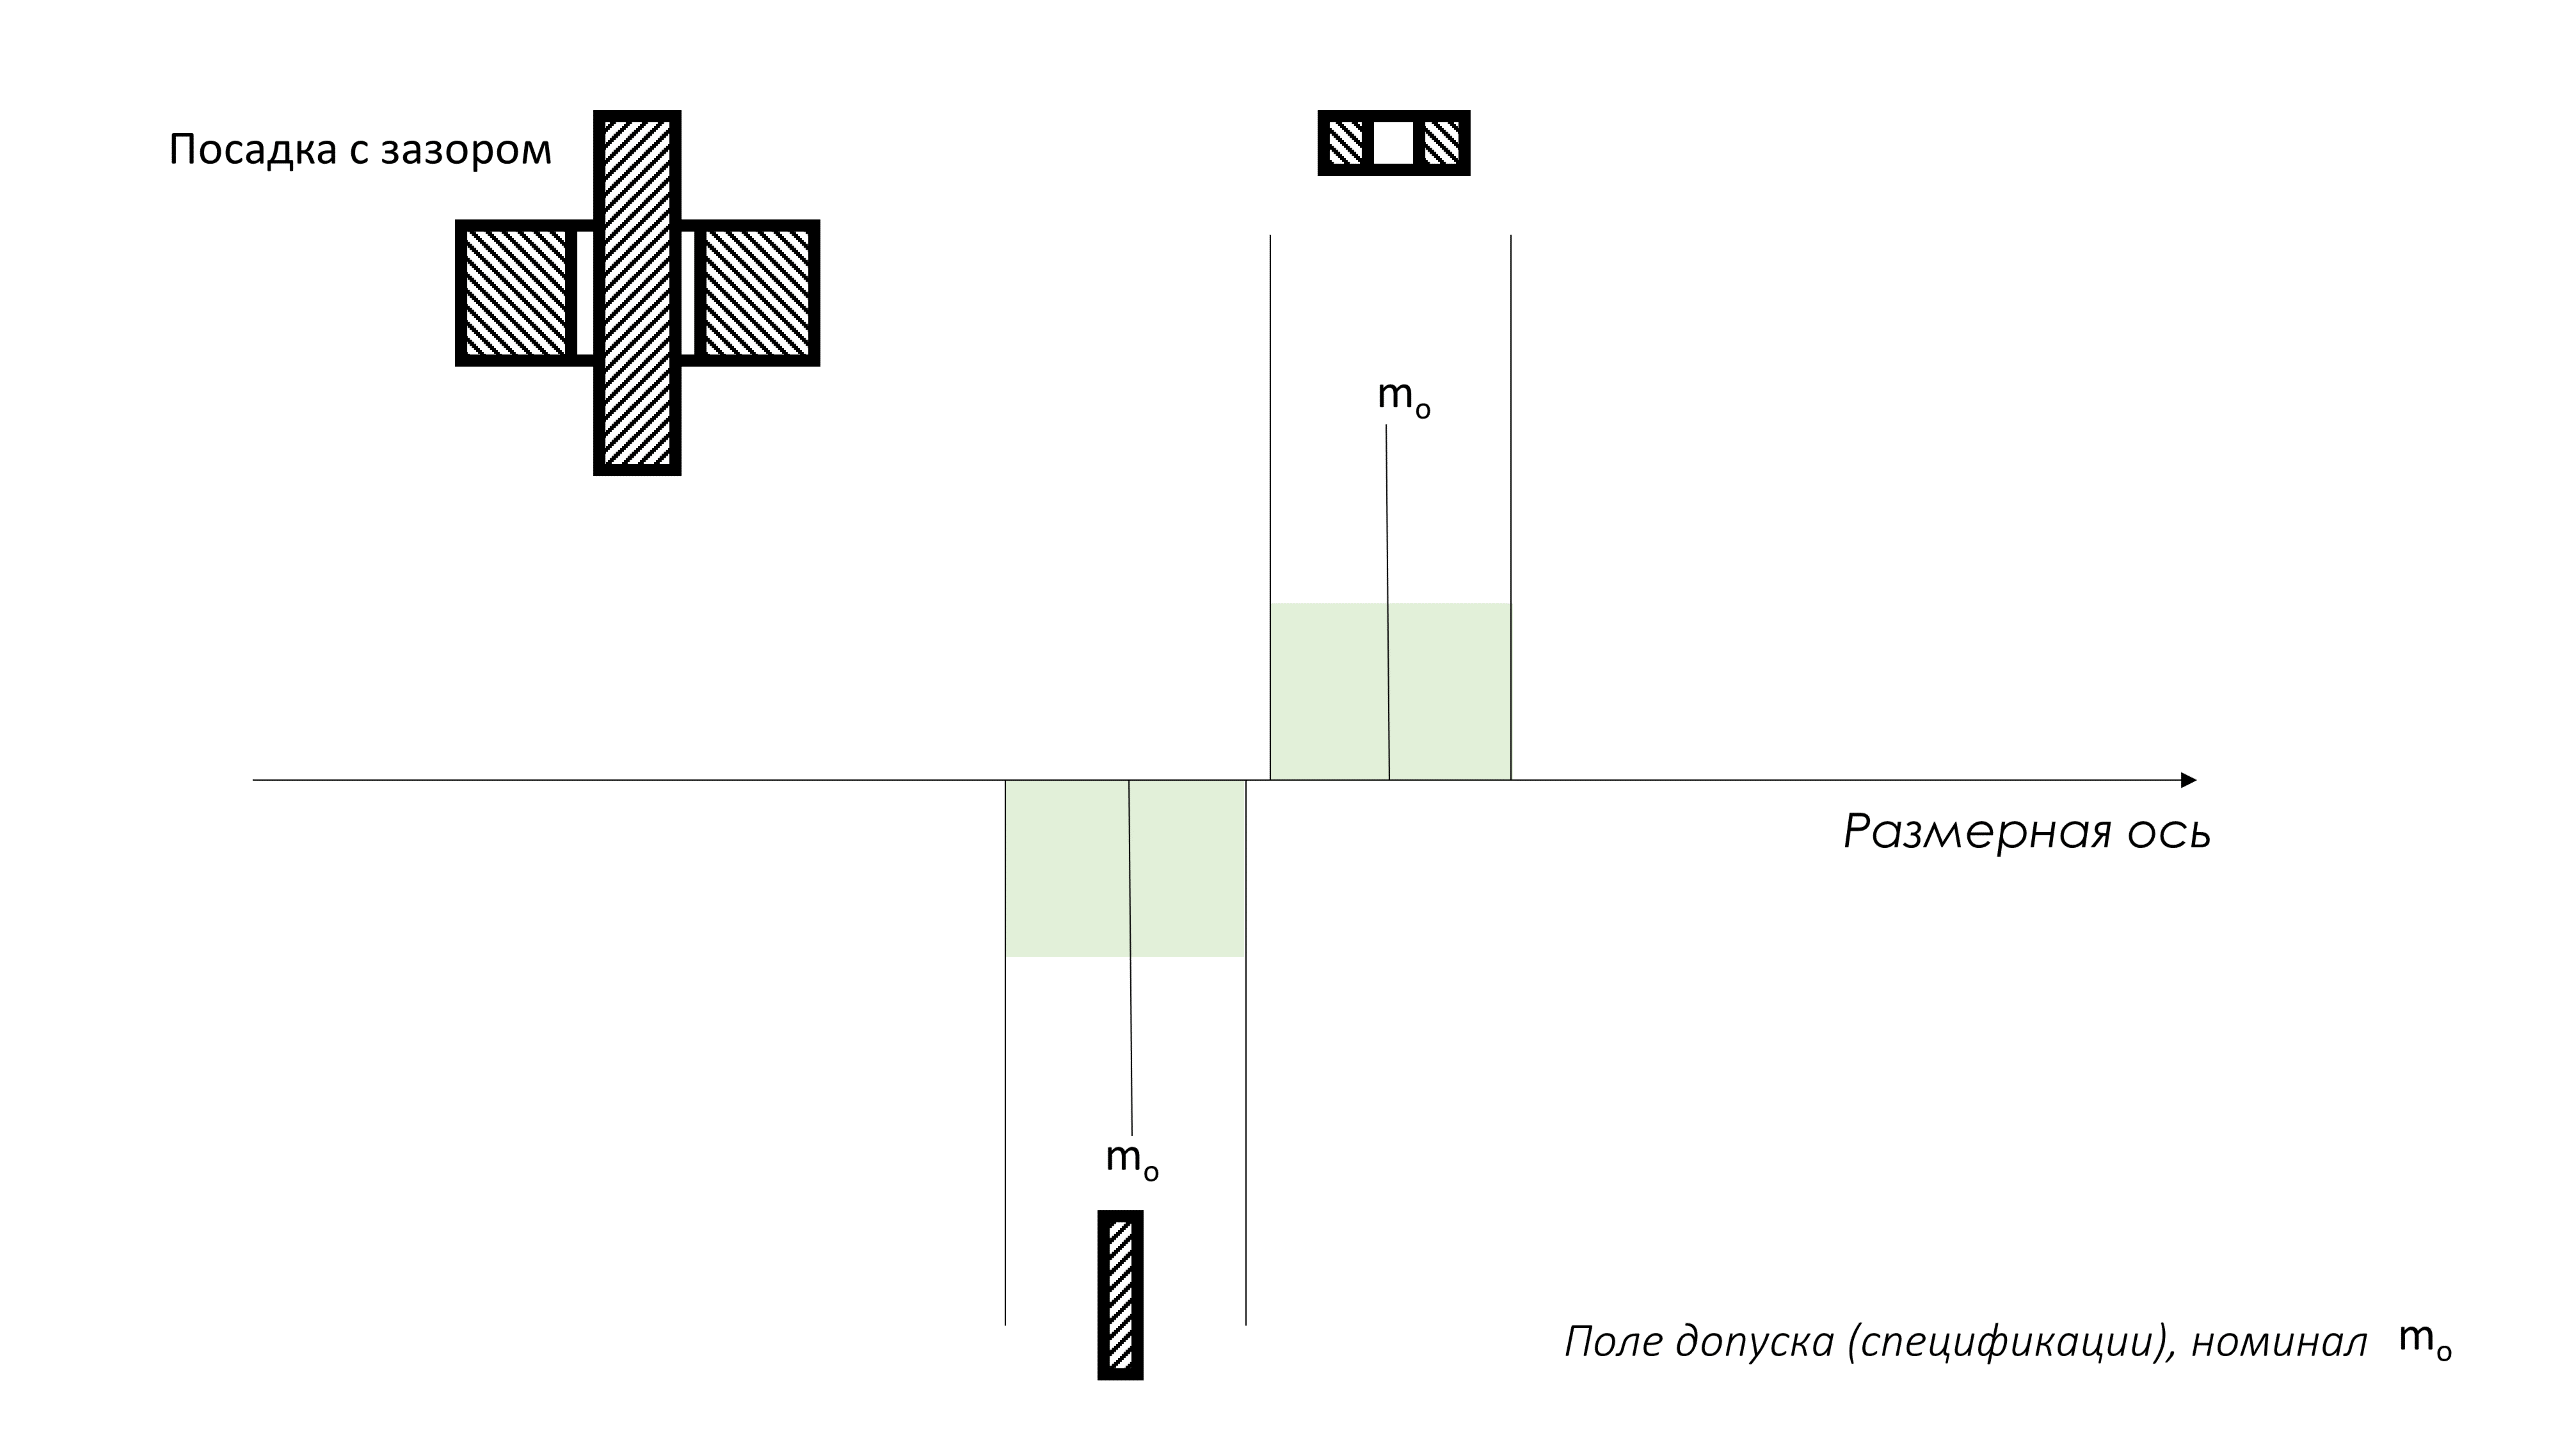
Figure 3. Conditional display of the pairing of the tolerance fields of the shaft and hole (clearance fit).
The ideal manufacturing processes that will produce the parts, in this case, should correspond to the distribution densities of individual measurements (symmetrical bell-shaped curves are chosen arbitrarily), as presented in Figure 4 below: stable, perfectly centered and with a distribution of individual values within the tolerance zone with some free space . In this case, it is known in advance that all parts will be 100% suitable. It will be enough to carry out a rare sampling of parts for control to confirm the stable state of the processes and to control the adjustment of the average (central line) of the distribution of such processes to the nominal tolerance field.
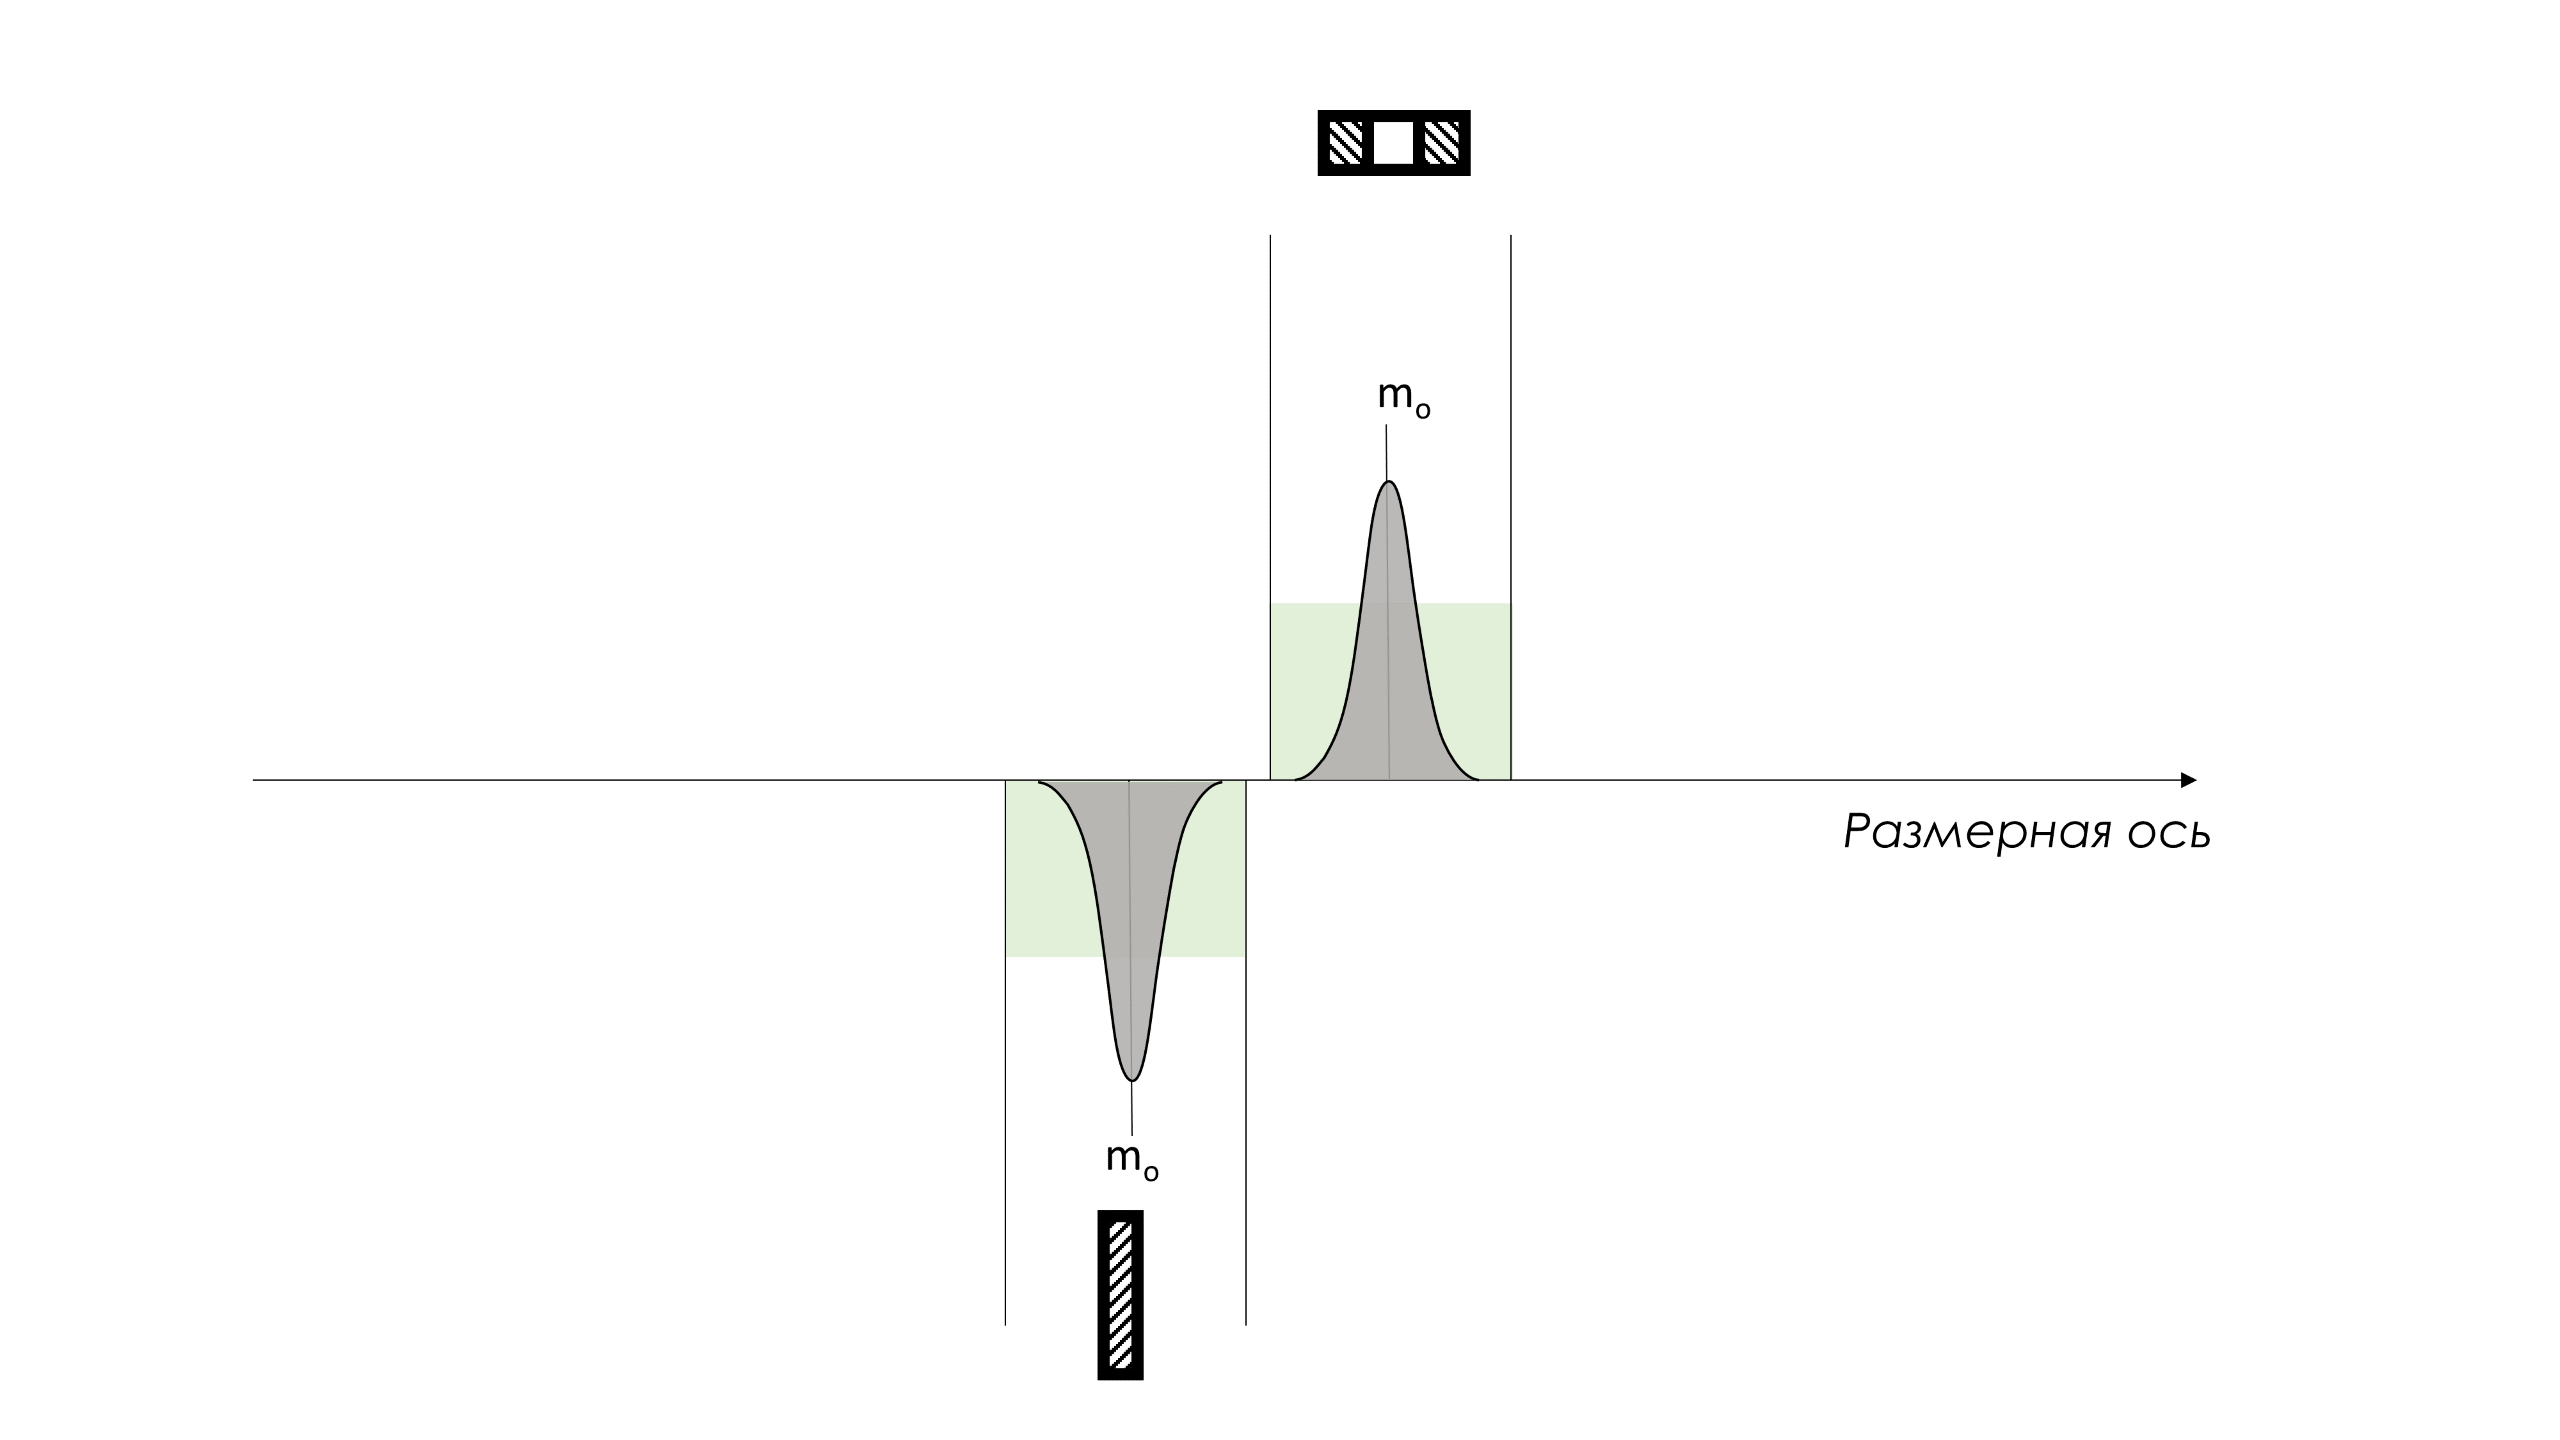
Figure 4. Stable and perfectly centered production processes, with individual values distributed within a tolerance zone with some free space.
Now consider the option in the figure below, when production processes are in a statistically controlled (stable) state, their spread 6σ is less than the width of the tolerance field (for example, Cp≥1.33), but they are not centered. Then, some of the products will be outside the tolerance range and defective. There will not be a single detail at face value. It will be necessary to divide all produced parts into those that comply with the tolerance zone and those that do not, carrying out 100% control, which is expensive and ineffective. In this case, it is known in advance that almost half of the parts will not comply with the tolerance range. See description of formulas calculation of reproducibility indices Cp and Cpk .
Formula for calculating the reproducibility index: Cp = tolerance range / 6σ
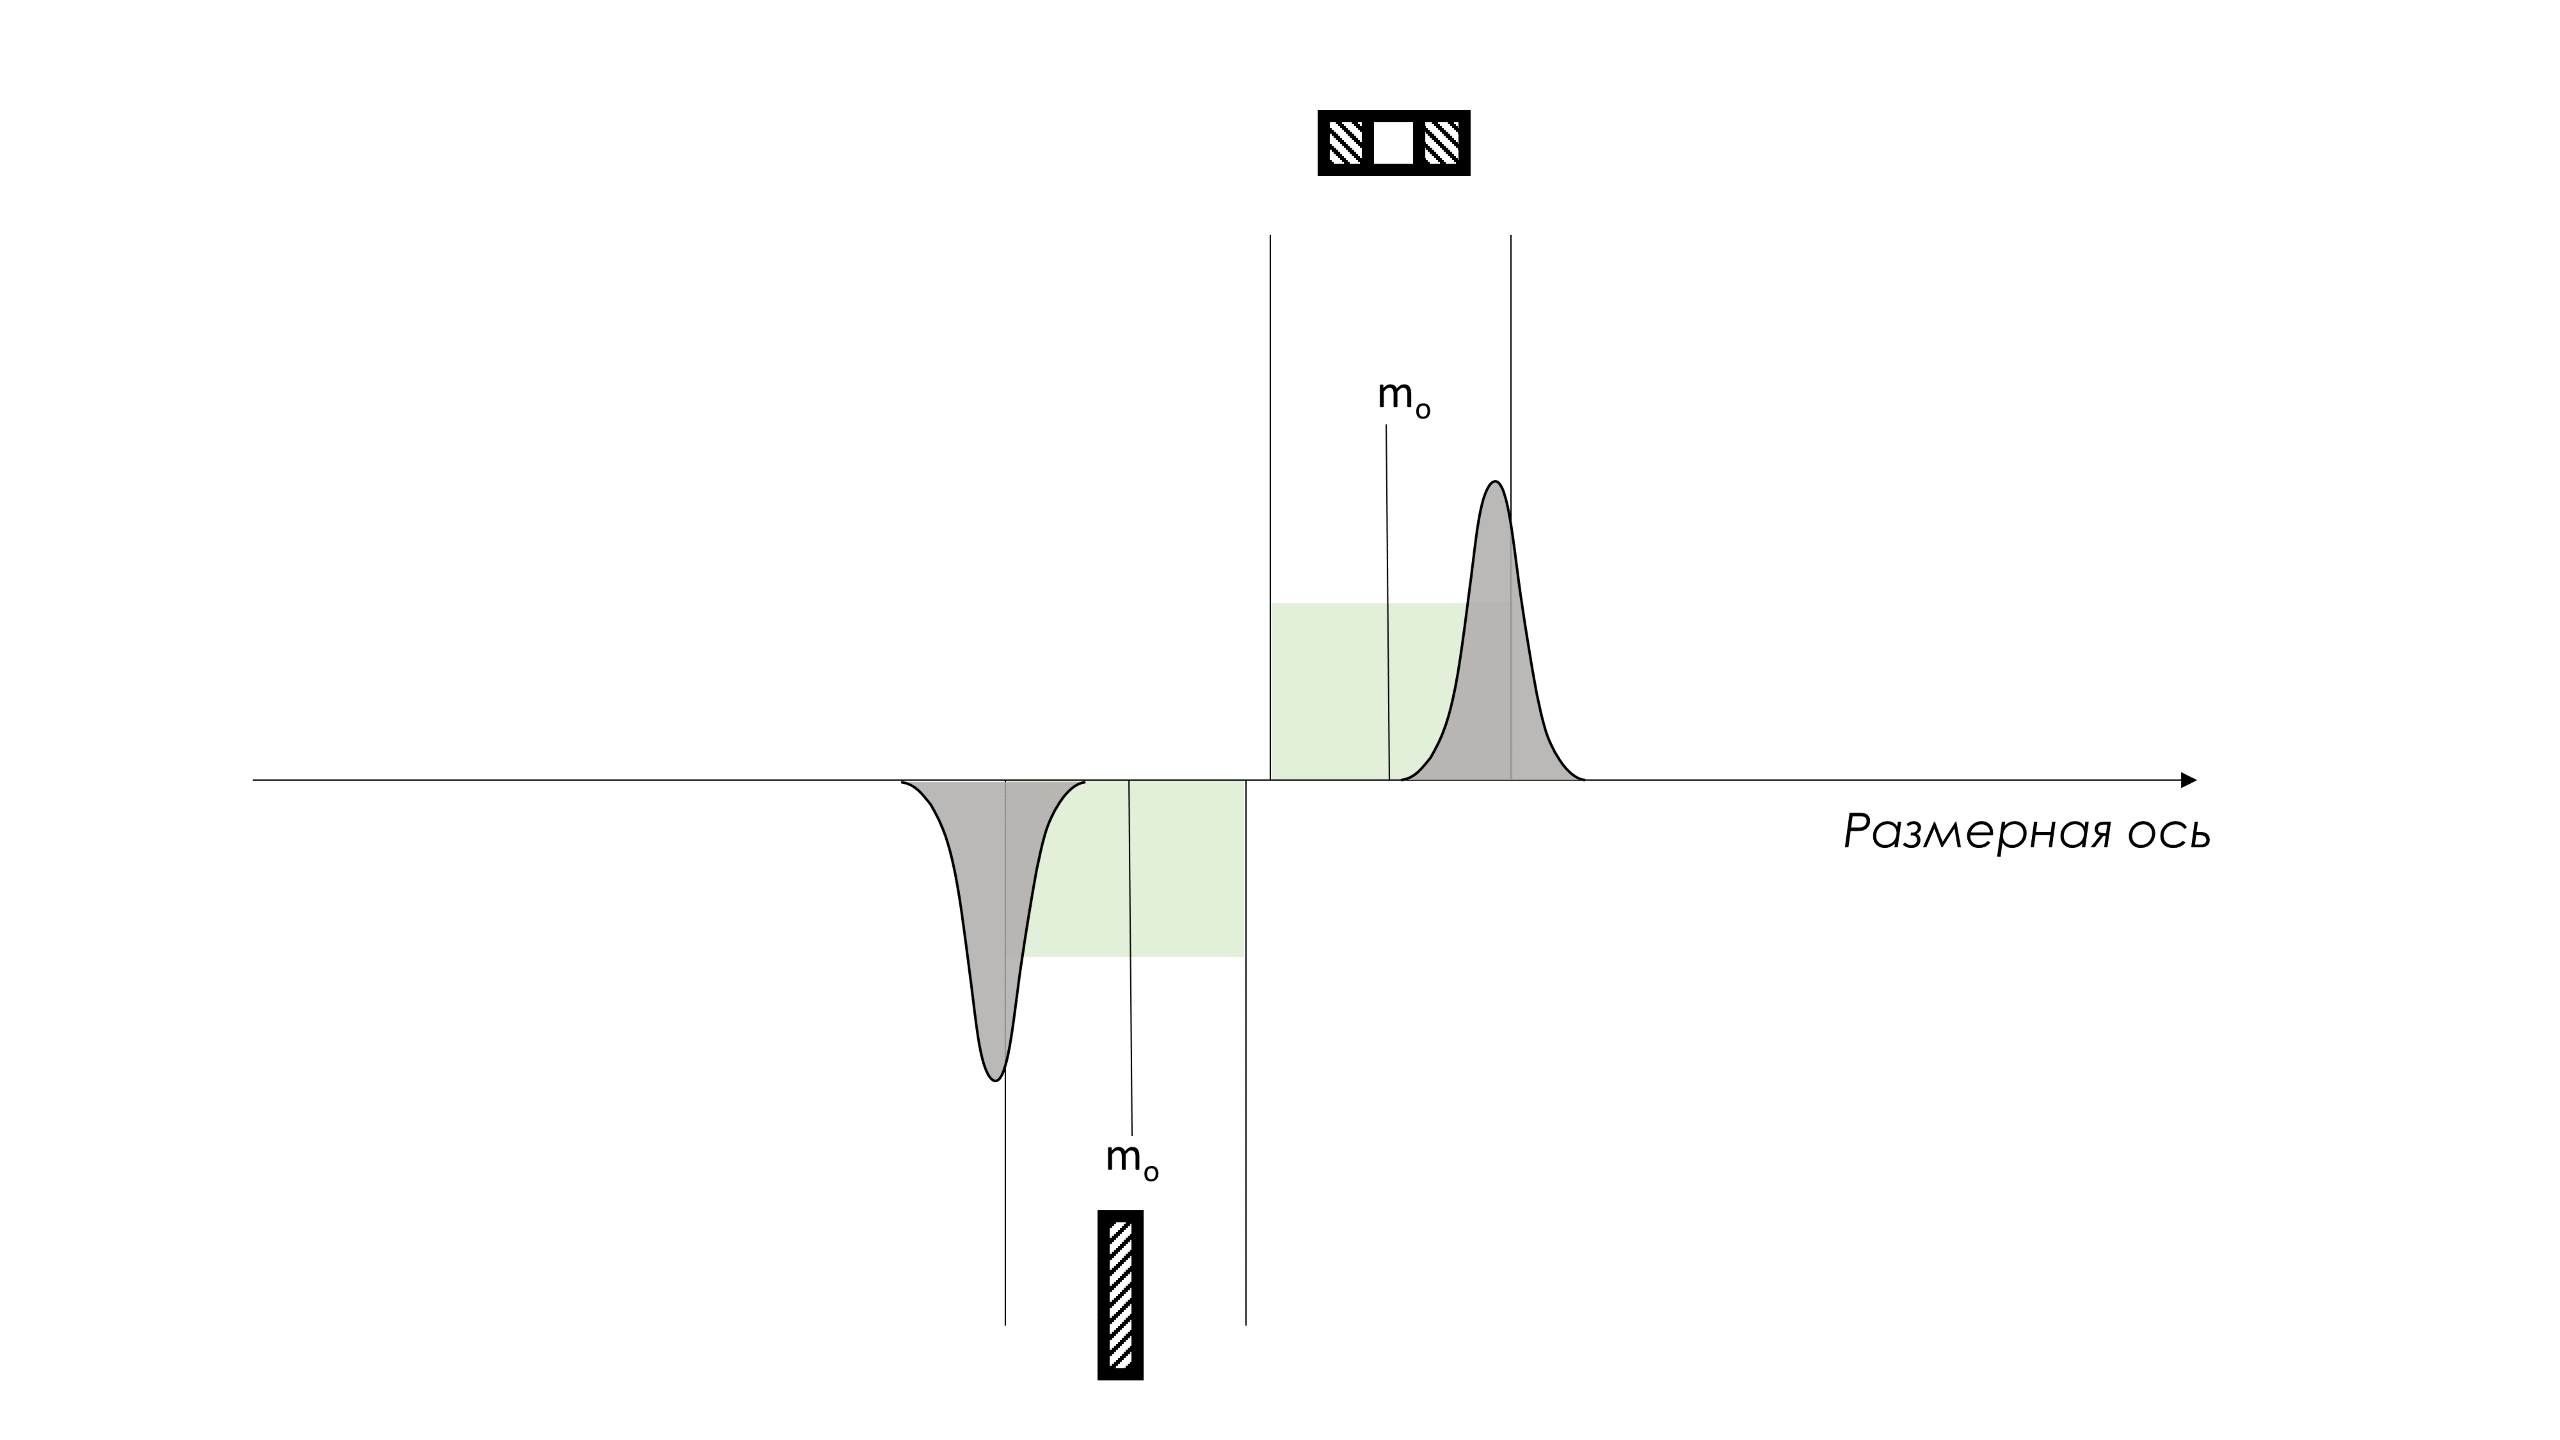
Figure 5. Production processes are in a statistically controlled (stable) state, their spread 6σ is less than the width of the tolerance field (for example, Cp≥1.33), but they are not centered.
Next, consider the option (see Figure 6 below) when production processes are in a statistically controlled state, their spread 6σ is greater than the width of the tolerance field (for example, Cp<1.00), and they are perfectly centered (for example, Cpk≈Cp). Then, again, part of the manufactured products will be outside the tolerance range. All produced parts will have to be divided into those that comply with the tolerance zone and those that do not, carrying out 100% control. In this case, it is known in advance that some parts will not meet the tolerance.
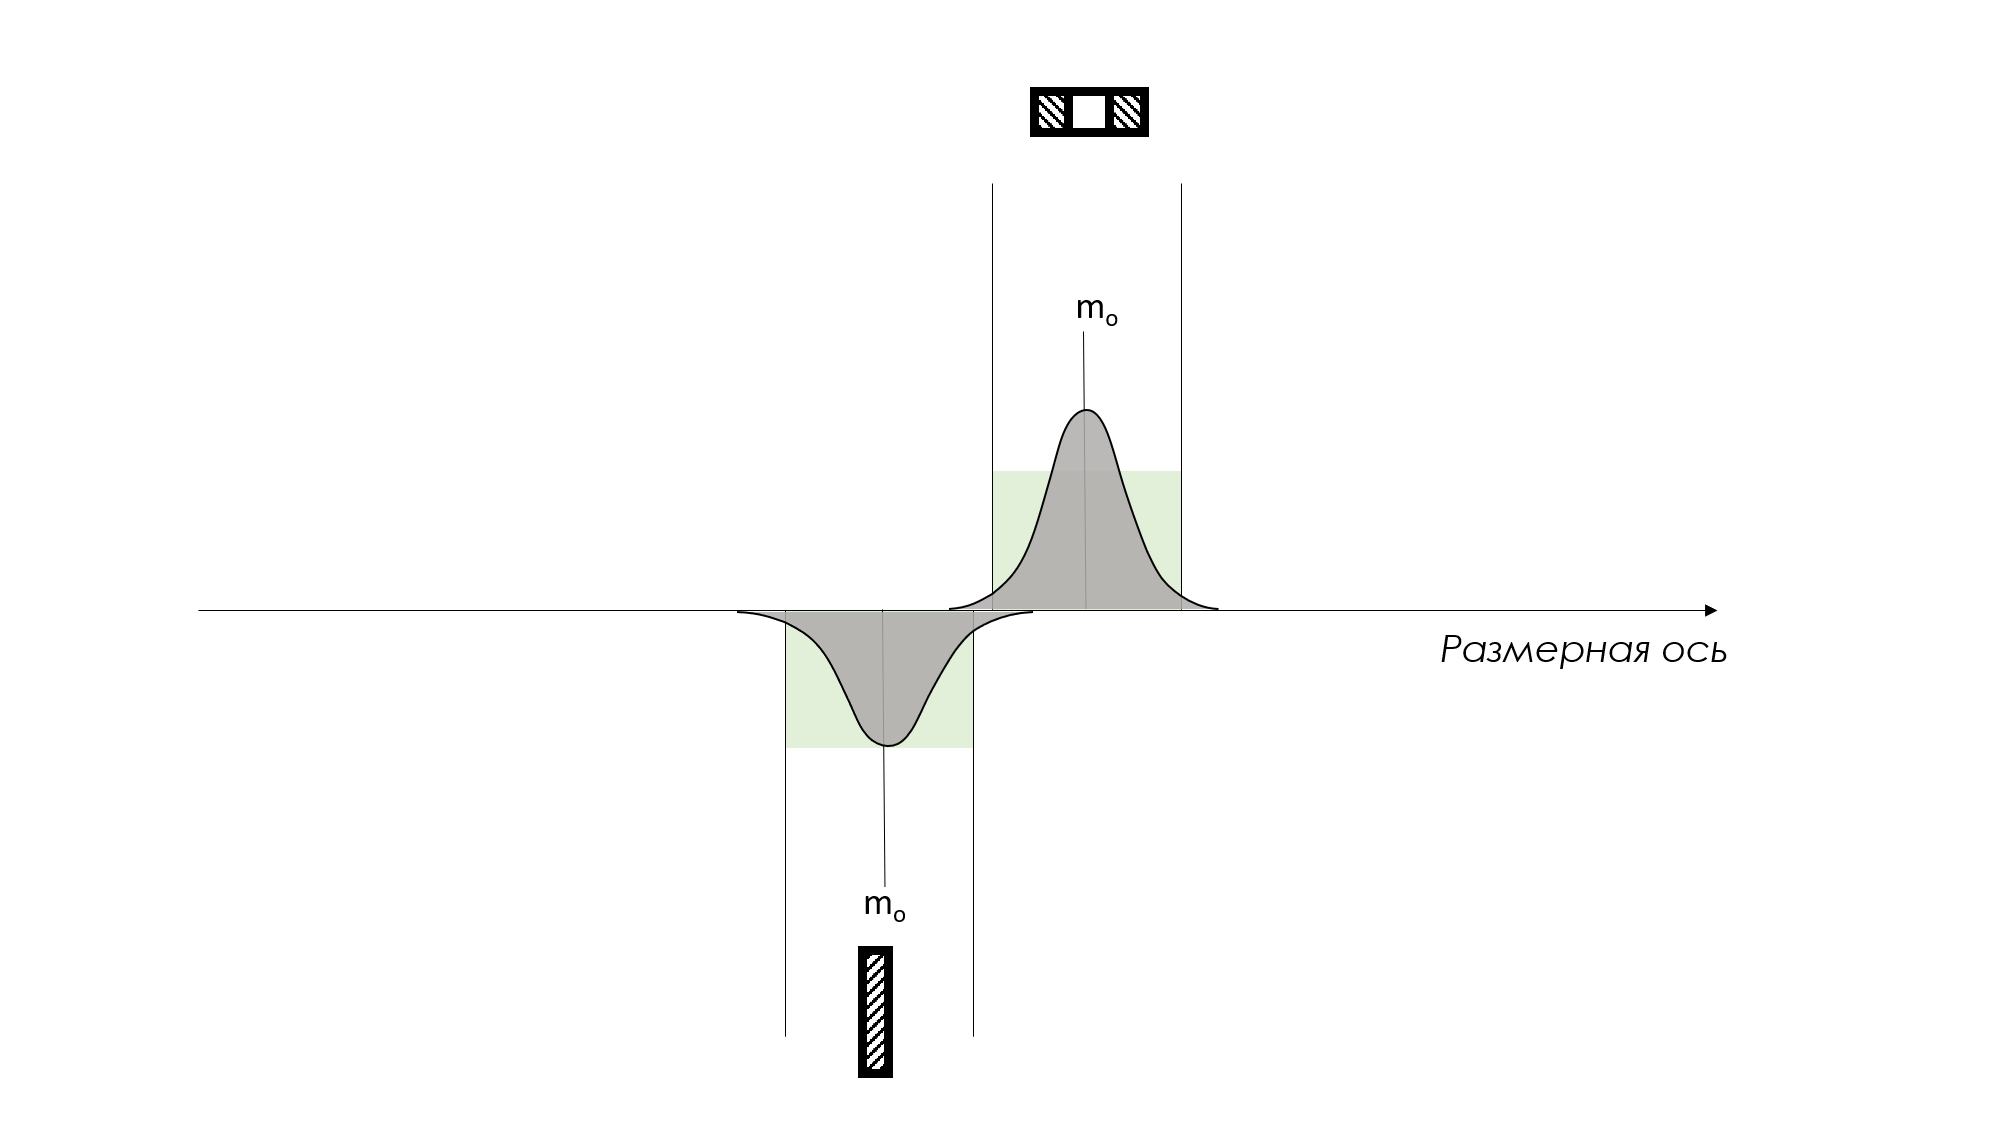
Figure 6. Manufacturing processes are in a statistically controlled (stable) state, their spread 6σ is greater than the width of the tolerance field (for example, Cp<1.00), and they are perfectly centered (for example, Cpk≈Cp).
Next, consider the option (see Figure 7 below) when production processes are in a statistically controlled state, their spread 6σ is greater than the width of the tolerance field (for example, Cp<1.00), and they are not centered (Cpk<Cp). Then, even more of the products will be outside the tolerance range. The consequences are obvious. All produced parts will have to be divided into those that comply with the tolerance zone and those that do not, carrying out 100% control. In this case, it is known in advance that more than half of the parts will be inappropriate.
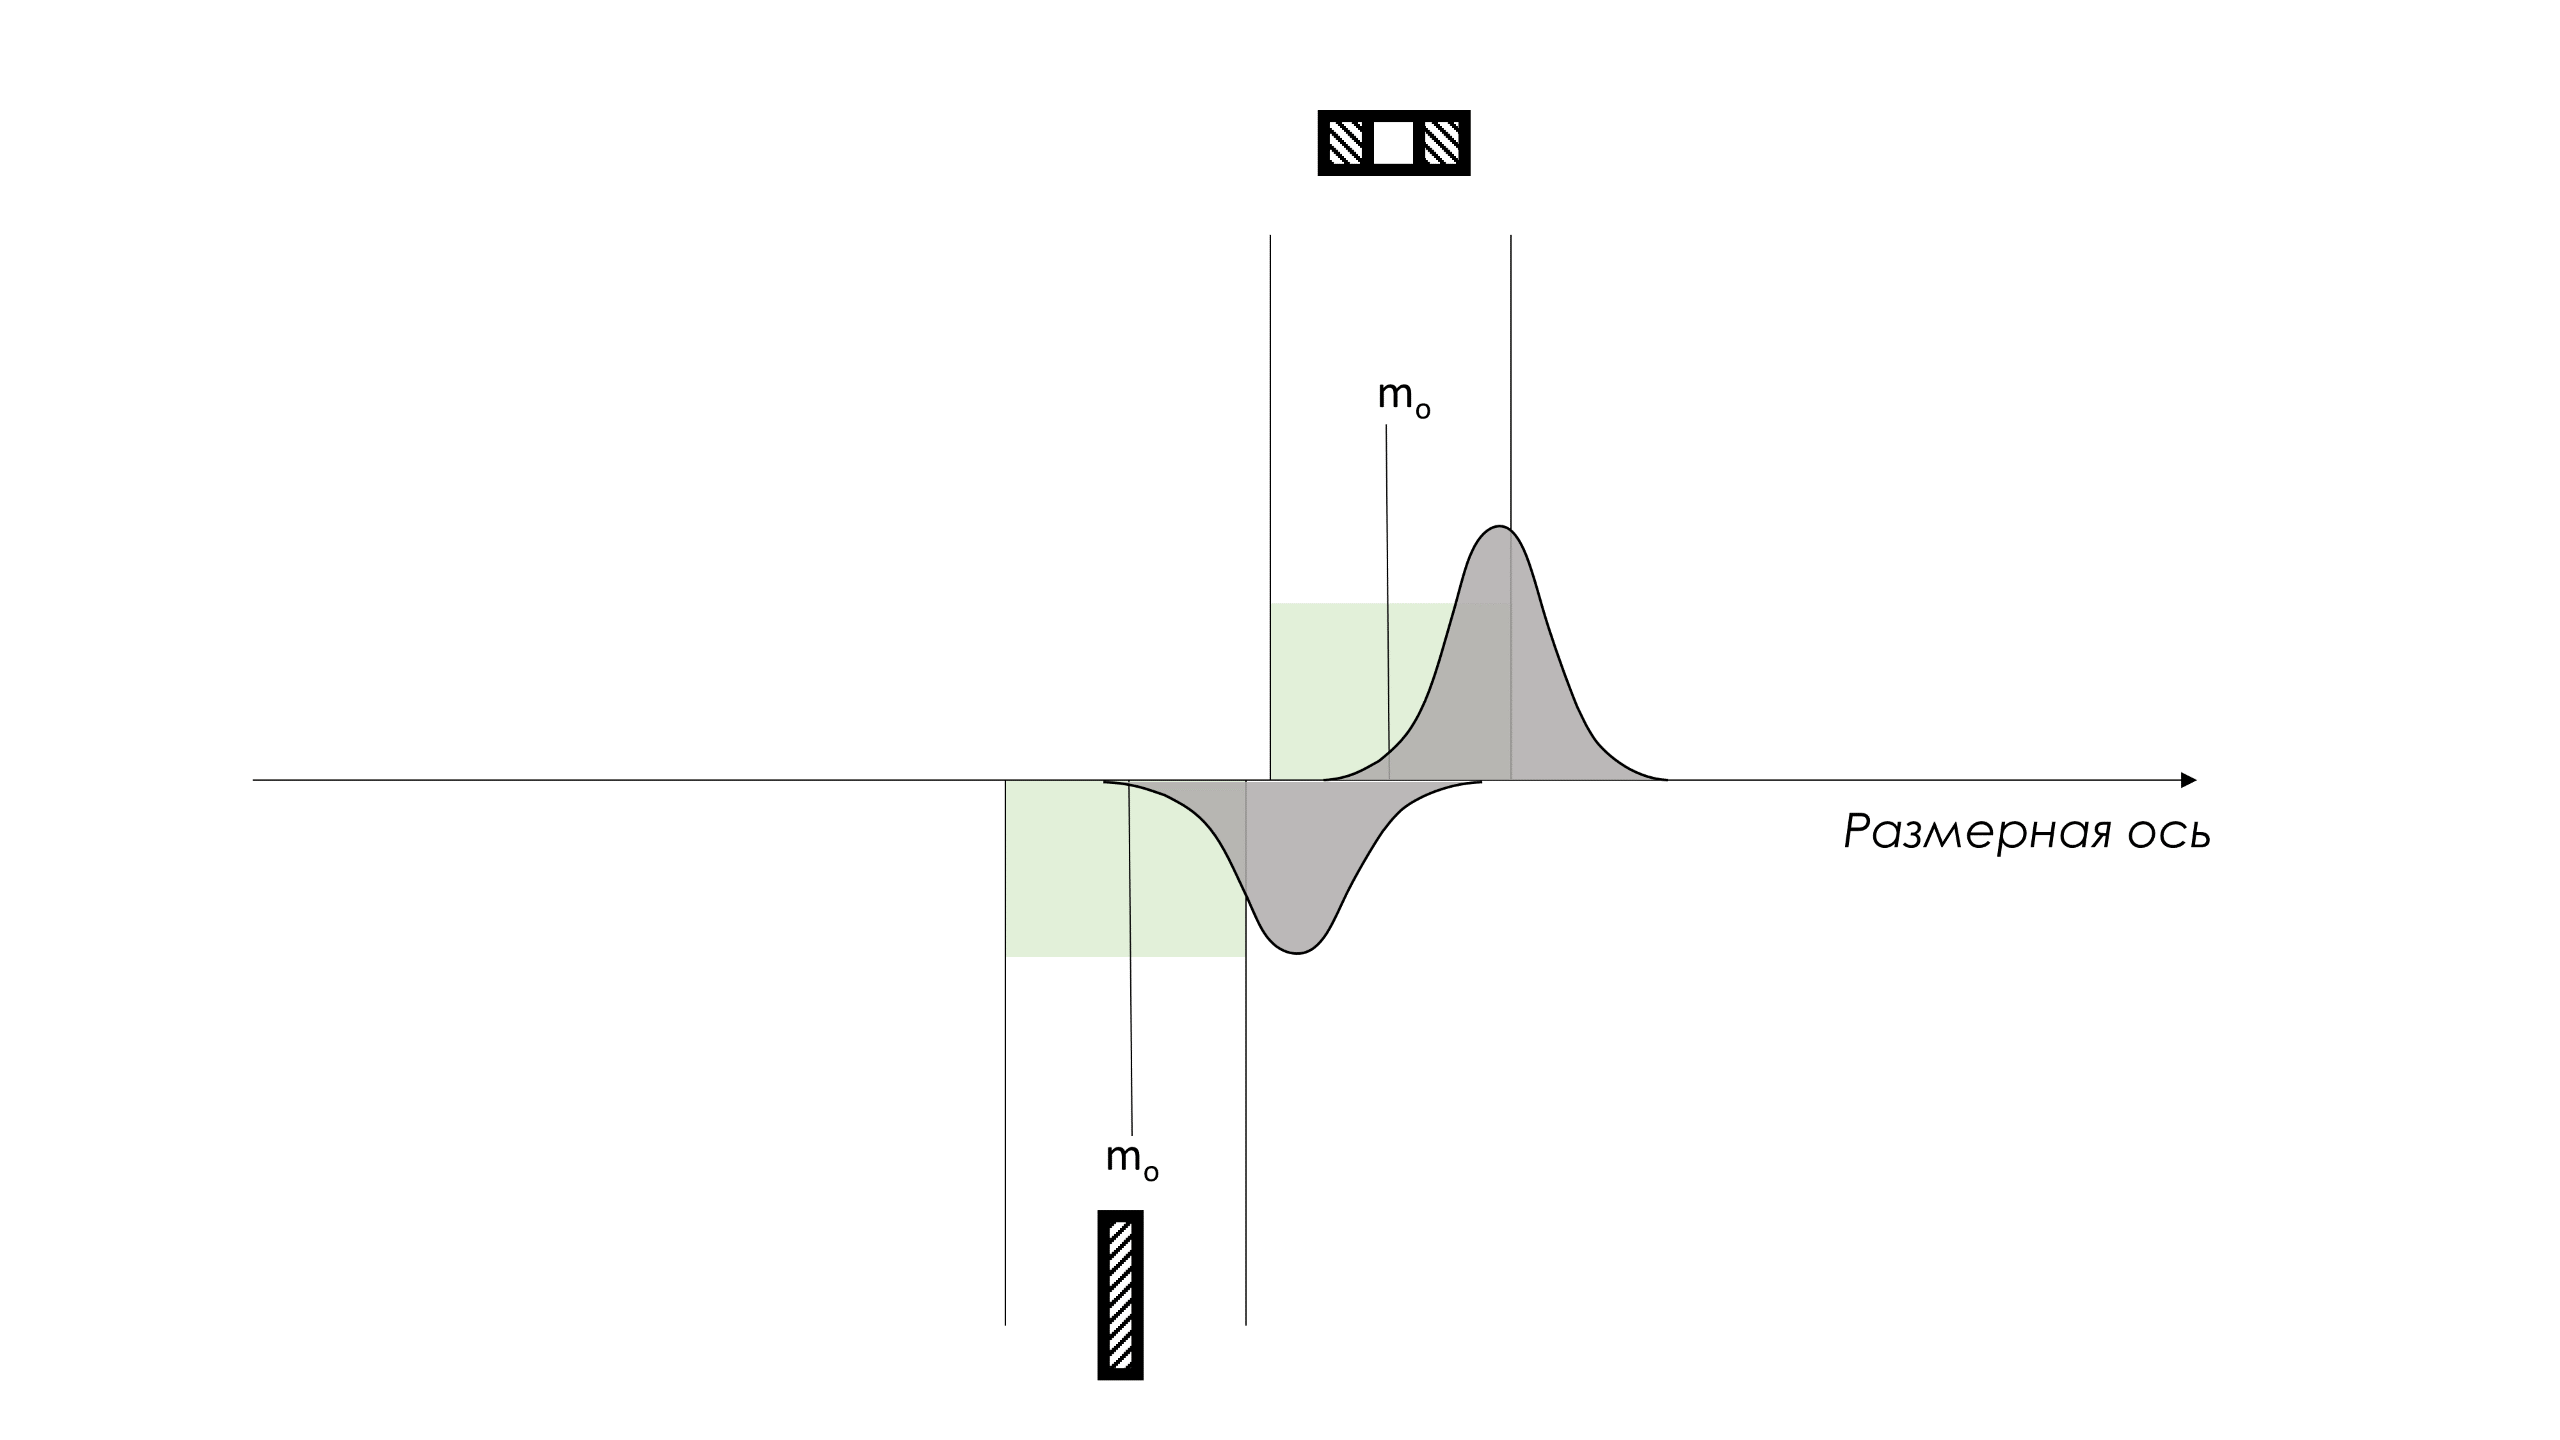
Figure 7. Production processes are in a statistically controlled (stable) state, their spread 6σ is greater than the width of the tolerance field (for example, Cp<1.00), and they are not centered (Cpk<Cp).
Figure 8 below is another option that matches the condition described for Figure 7 above. Again, the consequences are obvious. All produced parts will have to be divided into those that comply with the tolerance zone and those that do not, carrying out 100% control. In this case, it is known in advance that more than half of the parts will be inappropriate.
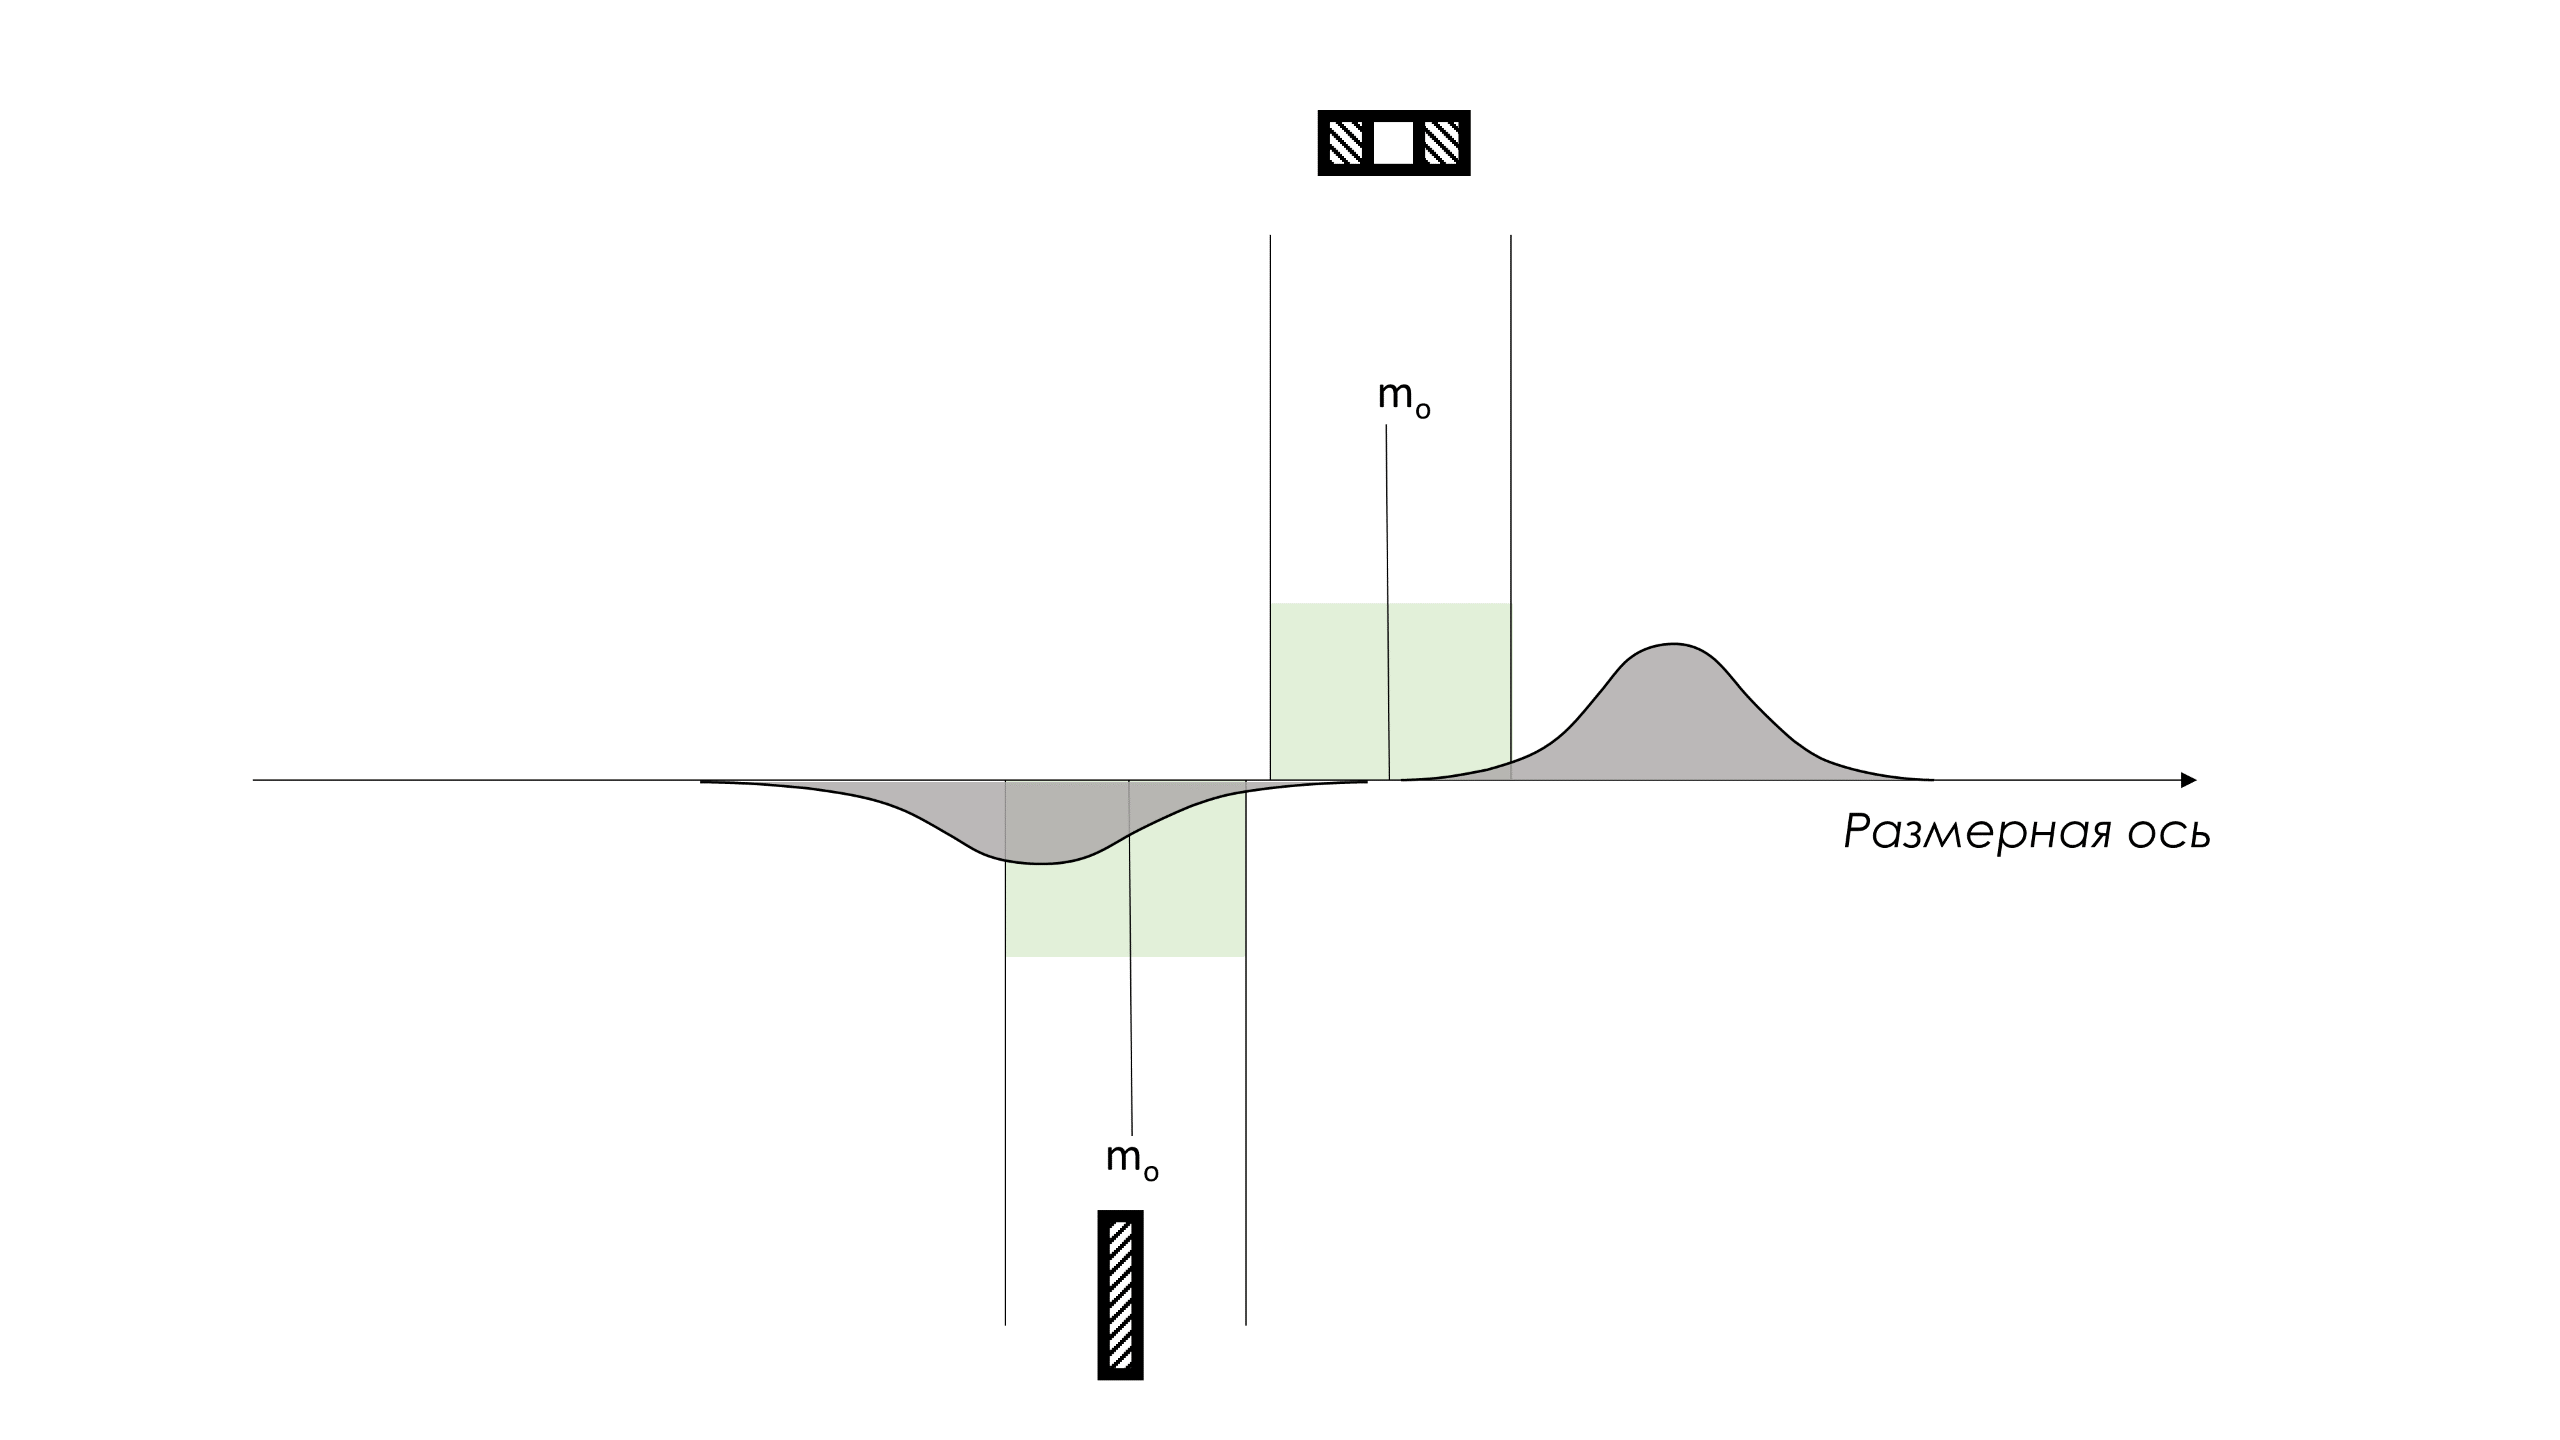
Figure 8. A special case of the option from Figure 7. Production processes are in a statistically controlled (stable) state, their spread 6σ is greater than the width of the tolerance field (for example, Cp<1.00), and they are not centered (Cpk<Cp).
The figure below shows another option, when real production processes are in a statistically uncontrollable (unpredictable) state. Their spread 6σ unpredictably narrows and then expands, their average also unpredictably changes its position relative to the nominal tolerance field. All produced parts will have to be divided into those that comply with the tolerance zone and those that do not, carrying out 100% control. No one knows in advance how many details will be inconsistent, maybe 100%. No one can predict the behavior of statistically uncontrollable processes. The total total losses of the enterprise from the unpredictability of production processes are maximum! The parts produced by such processes are not uniform.
The digital model may be ideal, but the company's losses as a whole may be maximum.
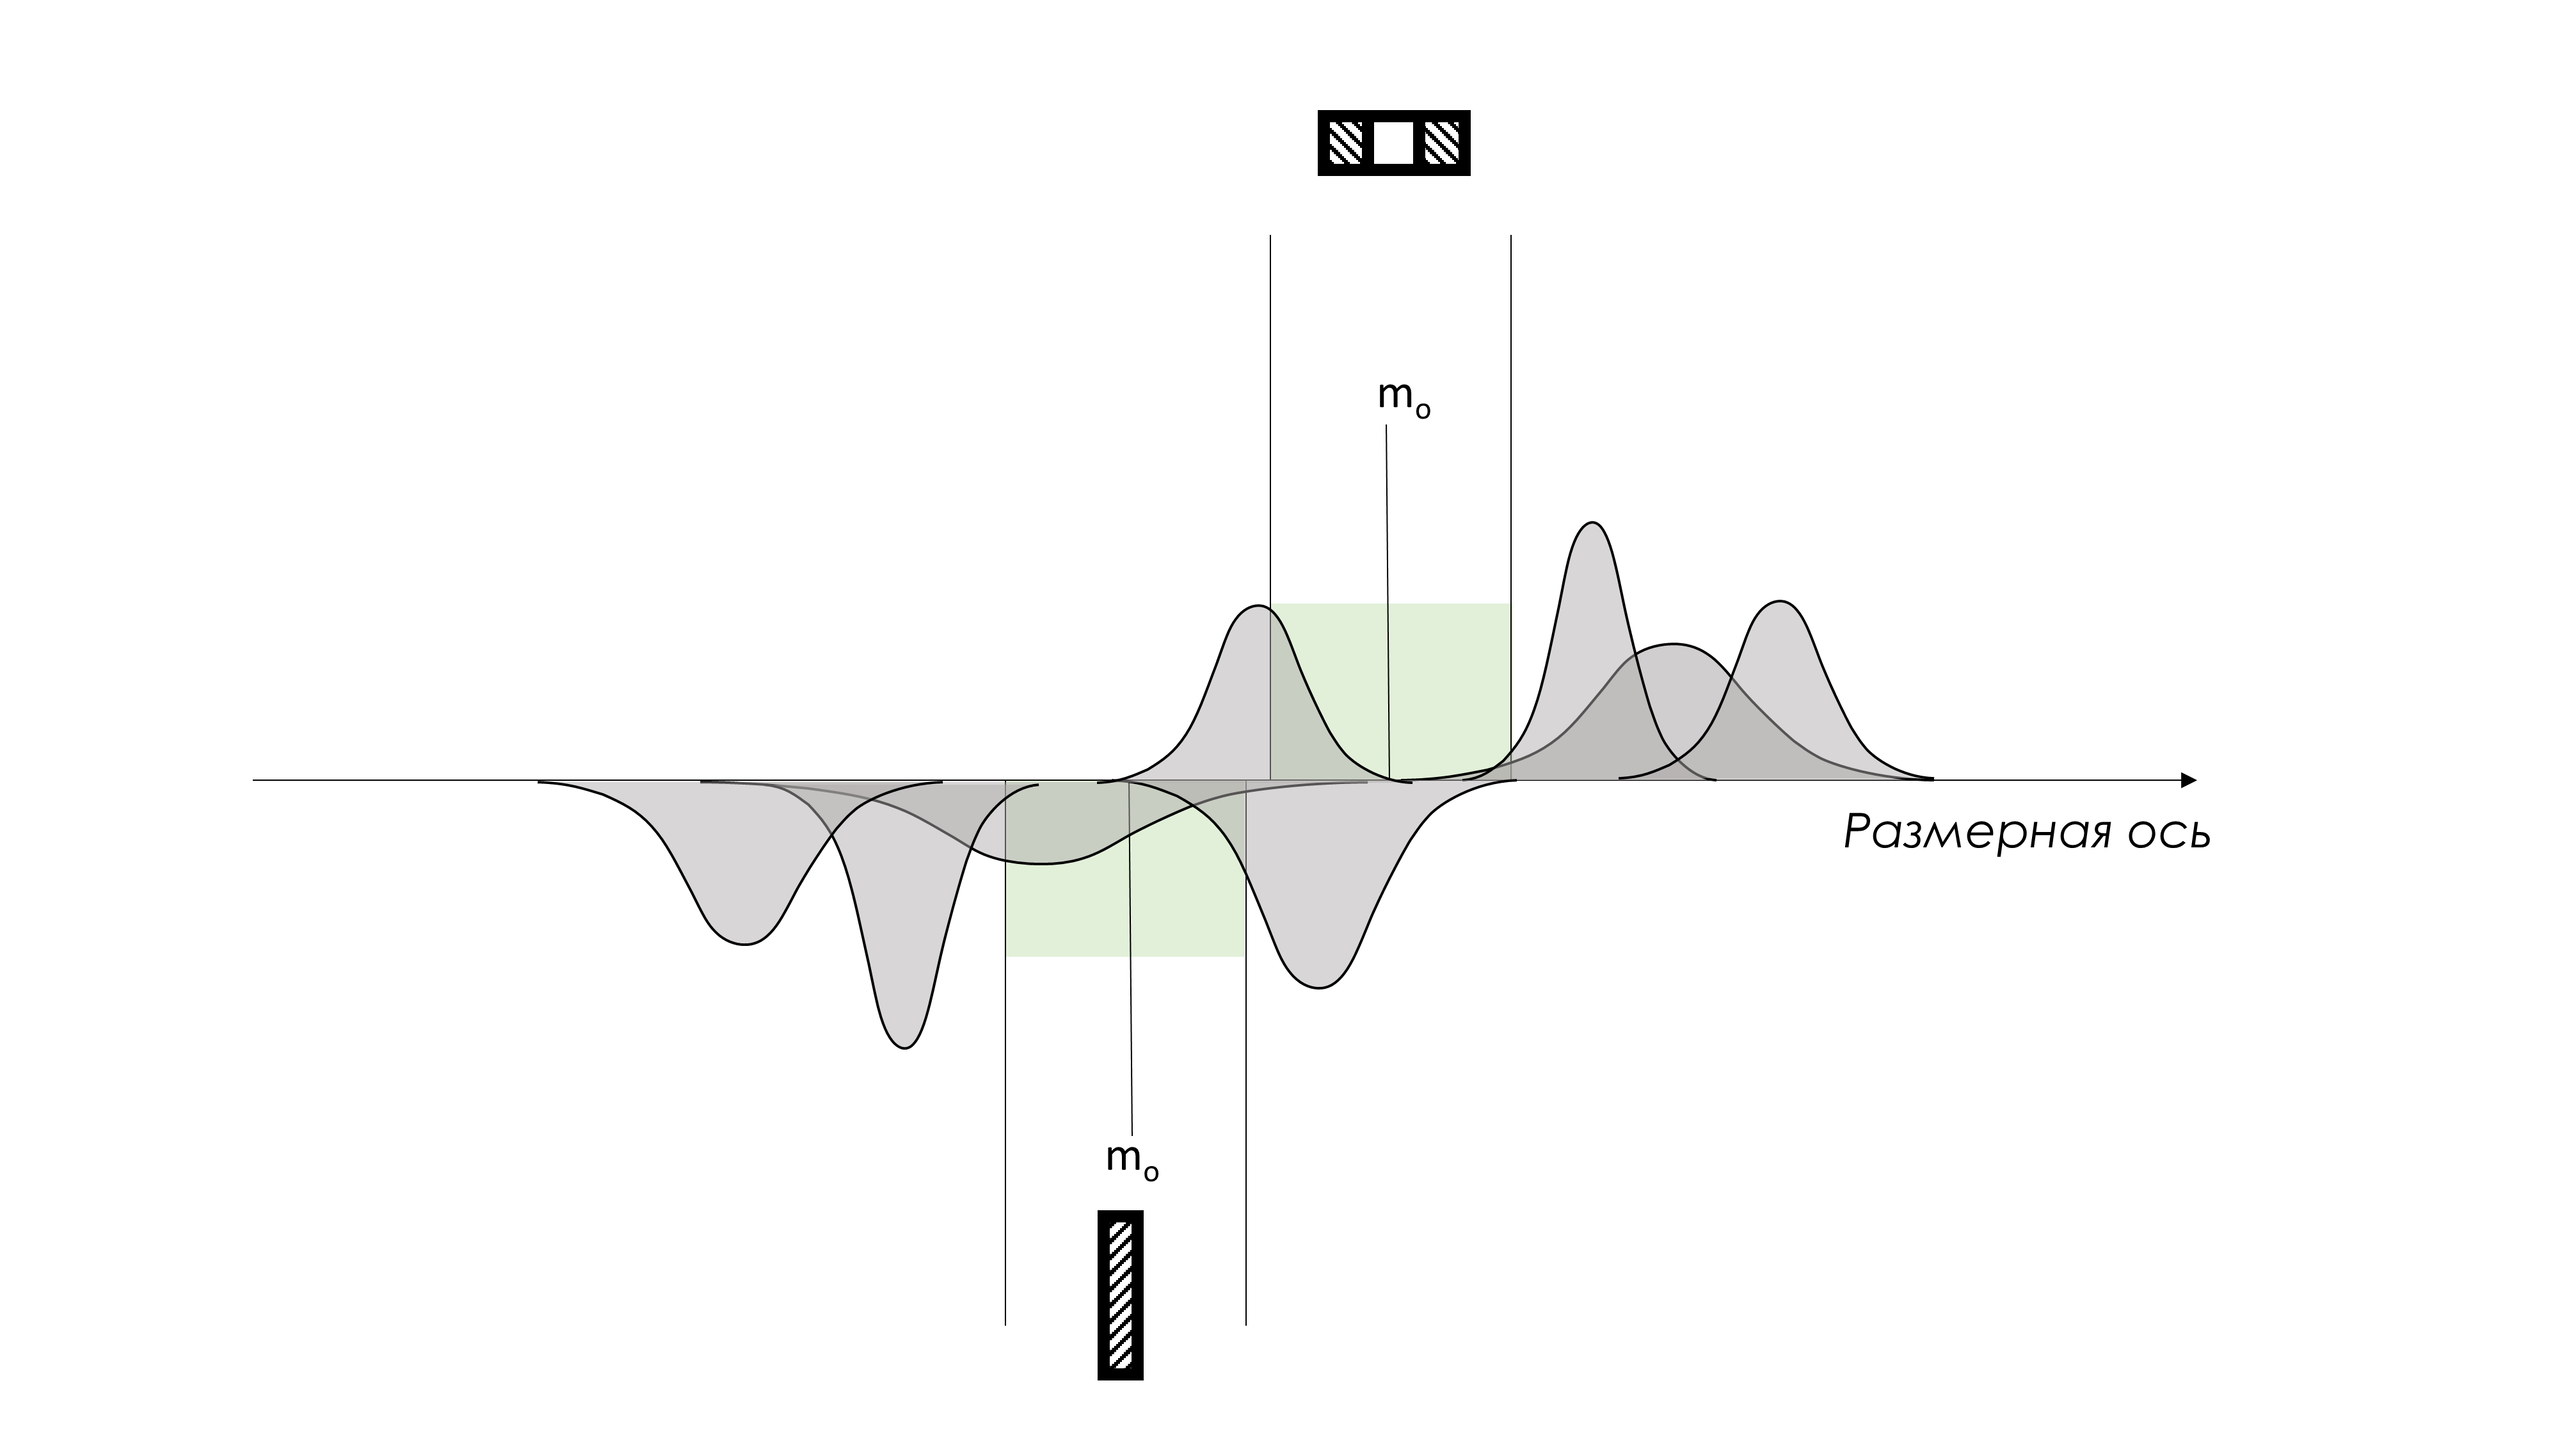
Figure 9. Production processes are in a statistically uncontrollable (unpredictable) state. Their spread 6σ unpredictably narrows or expands, their average also unpredictably changes its position relative to the nominal tolerance field.
Additional and important points in this matter are the mandatory requirement of stability of the measurement system, analysis of the bias of the measurement system, taking into account the error of the measurement system in more stringent production specifications. The latter is discussed in our article: Is the product on specification actually compliant? .
Finally, we came to the problem associated with sub-optimization on a digital model instead of the need to optimize the activities of all divisions of the company, as a system as a whole, according to its goals, for example, the production of reliable serial engines with a minimum cost of ownership for operators.
"Sub-optimization is easier to achieve than optimization. However, sub-optimization is not cheap. Sub-optimization may create the illusion of improvement, but in reality it creates barriers that prevent real progress. Moreover, sub-optimization of one part often harms other parts, so that the overall change causes more harm." "It's not beneficial. It also makes it more difficult to make truly profitable changes."
From further conversation, it became clear that neither the production management nor the designers of this corporation knew how their actual production processes actually worked. But Shewhart control charts are still not used to assess the condition and improve processes.
In such a situation, design engineers are left to be content with tolerance fields and theoretical properties, again, of nominal materials, and production personnel, without the help of management and understanding the nature of variability, perform errors of the first and second kind in attempts to produce parts with the required characteristics and assemble the finished product.
Separate KPIs for different departments of the company only make matters worse.
What is happening at your enterprise?
Edwards Deming prepared questions to help management , here are some of them:
- Are your production processes stable?
- How do you know this?
- What data do you have?
- What are you doing to bridge the gap between product design, actual production and delivery?
If you don't have clear answers to the above questions, then how can you rely on a digital assembly process and replacing field testing with testing your digital model?!
"We lamented the waste of materials, human effort and machine time. The waste of knowledge when a company is unable to use and develop its existing potential is even more deplorable."
We see a lot of evidence of sub-optimization in the digital models themselves, without taking into account the overall system goals that the digital models were supposed to serve. All for the sake of suboptimization on the notorious development productivity and often thoughtless cost reduction, without due attention to production processes.
“Outputs cannot be considered without considering the purposes for which they were created.”
In an environment where product developer efficiency is viewed in terms of reducing development time and costs, relying on replacing real-life product testing with virtual testing is a mistake that can be very costly for the company as a whole. This is all an attempt to cut corners. Analyzing production process and after-sales data using Shewhart control charts will show how optimization of the design process has affected them.
“However, systematic analysis of production performance is necessary to determine whether improvement steps are achieving the goal and whether they are appropriate.”
The best and simplest tool for analyzing the effectiveness of improvement steps taken is Shewhart control charts.
The following excerpt is from Marvin Mandel's Measuring and Enhancing the Productivity of Service and Government Organizations - Aoyama Dai-ichi Mansions, 4-14 Akasaka 8-chome, Minatoku, Tokyo 107 , 1975. – pp. 3–4) sheds light on this issue:
“Outputs... cannot be considered without taking into account the purposes for which the systems were created.
To create some background, let's analyze a few examples. It is said that Thomas Edison, the great American inventor, proposed a voting machine to improve this procedure in the United States Congress. He demonstrated his device to the Speaker of Parliament and the President of the Senate. According to the inventor's idea, every congressman and senator would have three buttons on his chair: red to say “no,” green to “yes,” and white to “abstain.”
Edison suggested that at the beginning of the vote, participants would press the corresponding button, after which a report would instantly appear on how each person voted and what the overall results were. Edison proudly assured the Speaker and President of the Senate that his device would eliminate the errors that occur in the method of sequential roll-call voting, significantly reduce voting time, and provide other advantages.
He was completely shocked when the Speaker of the House of Representatives and the President of the Senate interrupted him in mid-sentence and declared that such a system was completely undesirable and, instead of improving the work of the House or Senate, would completely disrupt the smooth functioning of the Congress of the United States. What was an improvement from Edison's point of view was, on the contrary, a deterioration from the point of view of Congress. The length of the roll call process was integral to the deliberative process by which Congress decided what to do.
Edison's proposal - a quick vote - was inconsistent with the purposes of Congress."
What to do?
First of all, you will need to change your management style and get rid of deadly diseases and obstacles to transformation .
When designing products, move beyond the use of tolerance tables to consider real-world process capabilities with inherent variability in geometry, material properties, and other characteristics.
Please note that production specifications (tolerances) must take into account the error of your measurement systems, with at least a 96% probability of your control not missing defective products, i.e. be narrower than the client's tolerance for two probable errors of the measurement system on each side of the field client access. The measuring systems themselves must be stable! See this article for an explanation: Is the product on specification actually compliant?
Drive design changes, tolerance changes, or require manufacturing departments and suppliers to improve processes when necessary using Shewhart control charts under the guidance of an experienced instructor. And do not be content with empty response statements, demand statistical confirmation of quality characteristics in the form of control charts of key characteristics of products and processes.
I have demonstrated recommendations for improving production processes in the short video below.
Video 1. Process improvement roadmap. Symbols of elements in the video:. НГД and IOP - lower and upper tolerance limits, respectively (Eng, LSL and USL); m0 - nominal tolerance field; LGP and ВГП - lower and upper limits of the process (English LCL and UCL); CL - central line of the process (average).
Serious assistance in exchanging information and establishing teamwork between design, production, purchasing and sales departments can be provided by quality management tools of a new, even by world standards, class Quality Management System Software (QMS software) with SPC R&D modules QM, using data on the variability of key quality characteristics of both their own production processes and suppliers' processes using Shewhart control charts.
We offer integration of the full power of our software to Russian corporate applications: CAD (CAD)- , PLM- , ERP , MES- , LIMS systems , training and providing ongoing effective scientific and practical support to company employees.
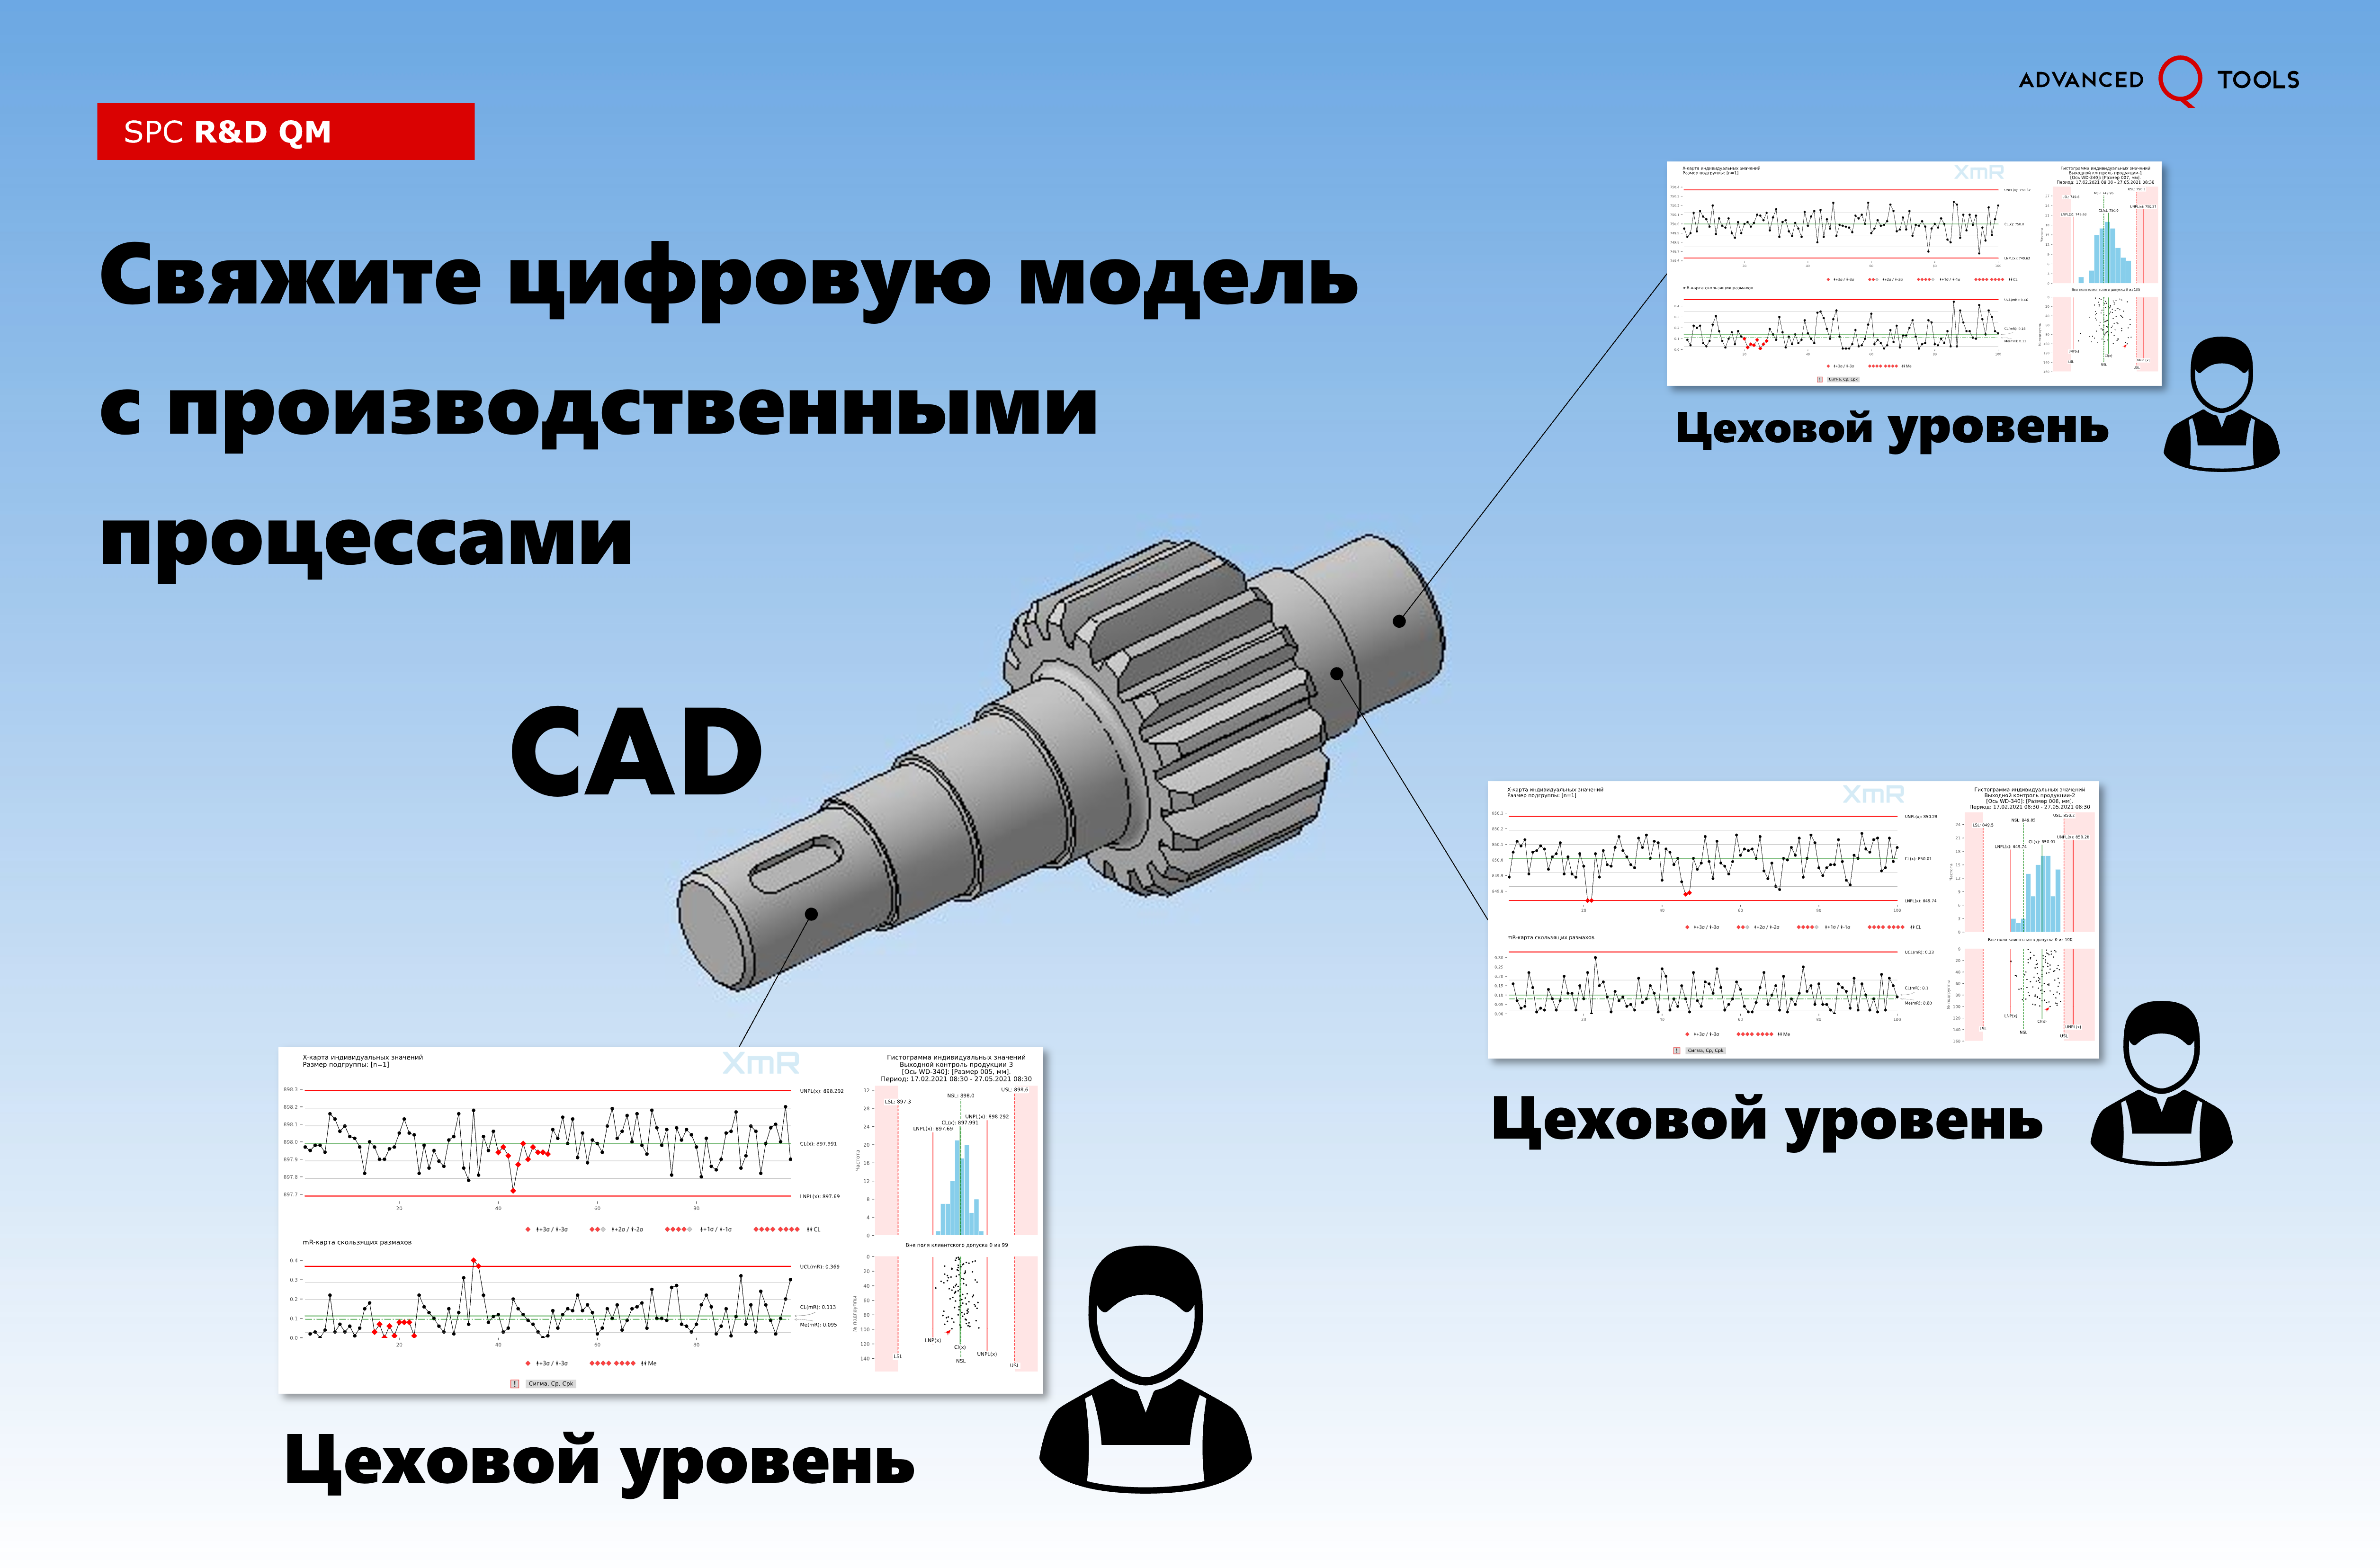

Figure 10. Next generation quality management tools SPC R&D QM. Interaction of supplier quality management, design and production functions.
One example of using statistical process control with a product design module is IBS QMS – a cross-industrial QMS (Quality Management System) class solution developed by Siemens PLM Software.
Again, fragmented and unsystematic use of statistical process control (SPC) methods, without a deep understanding of them, will not bring significant improvements to the company as a whole.
"Any organization planning to use control charts effectively must first break down all barriers described by Deming.
You can't just "implement statistical process control." Control charts do not work in a vacuum. Their use places certain demands on workers and management, and the organization must do everything possible to meet these demands. Once the control chart philosophy becomes part of the corporate culture or even part of the structure of the organization itself, occasional interference from workers or management will no longer be able to interfere with anything.
Statistical process control is, first of all, a whole worldview, supported by certain methods. It's a way of thinking, and that's what it's all about. Without such thinking, methods are completely useless! Only senior management can highlight the importance of control charts for continuous improvement. If senior management provides active support for this, the potential impact of implementing control charts will exceed all expectations! "
Finally, I would like to remind you of one of the four inextricably linked parts Deep knowledge systems , formalized by Edwards Deming, namely, in terms of understanding systems. And I propose not to get carried away with sub-optimization of any parts (divisions) of the system, but to focus on improving the interaction of all components of the system for its main goals.
“A system is a chain of interrelated functions or activities within an organization that work together to achieve the organization’s goals.
Figure 11. Production is considered as a system (materials from lectures by Edwards Deming, 1950, Japan)
The diagram illustrates the direction of not only the flow of materials, but also the flow of information necessary to manage the company as a system. Using a framework provides feedback for continuous improvement of a product or service, for continuous learning."
For reference
Foreign industrial corporations have long begun to use two-dimensional (2D) statistical analysis methodology to improve design processes. Below is a screenshot of the pages of a Boeing document from 1998, which can be downloaded in the section bibliographies our site.
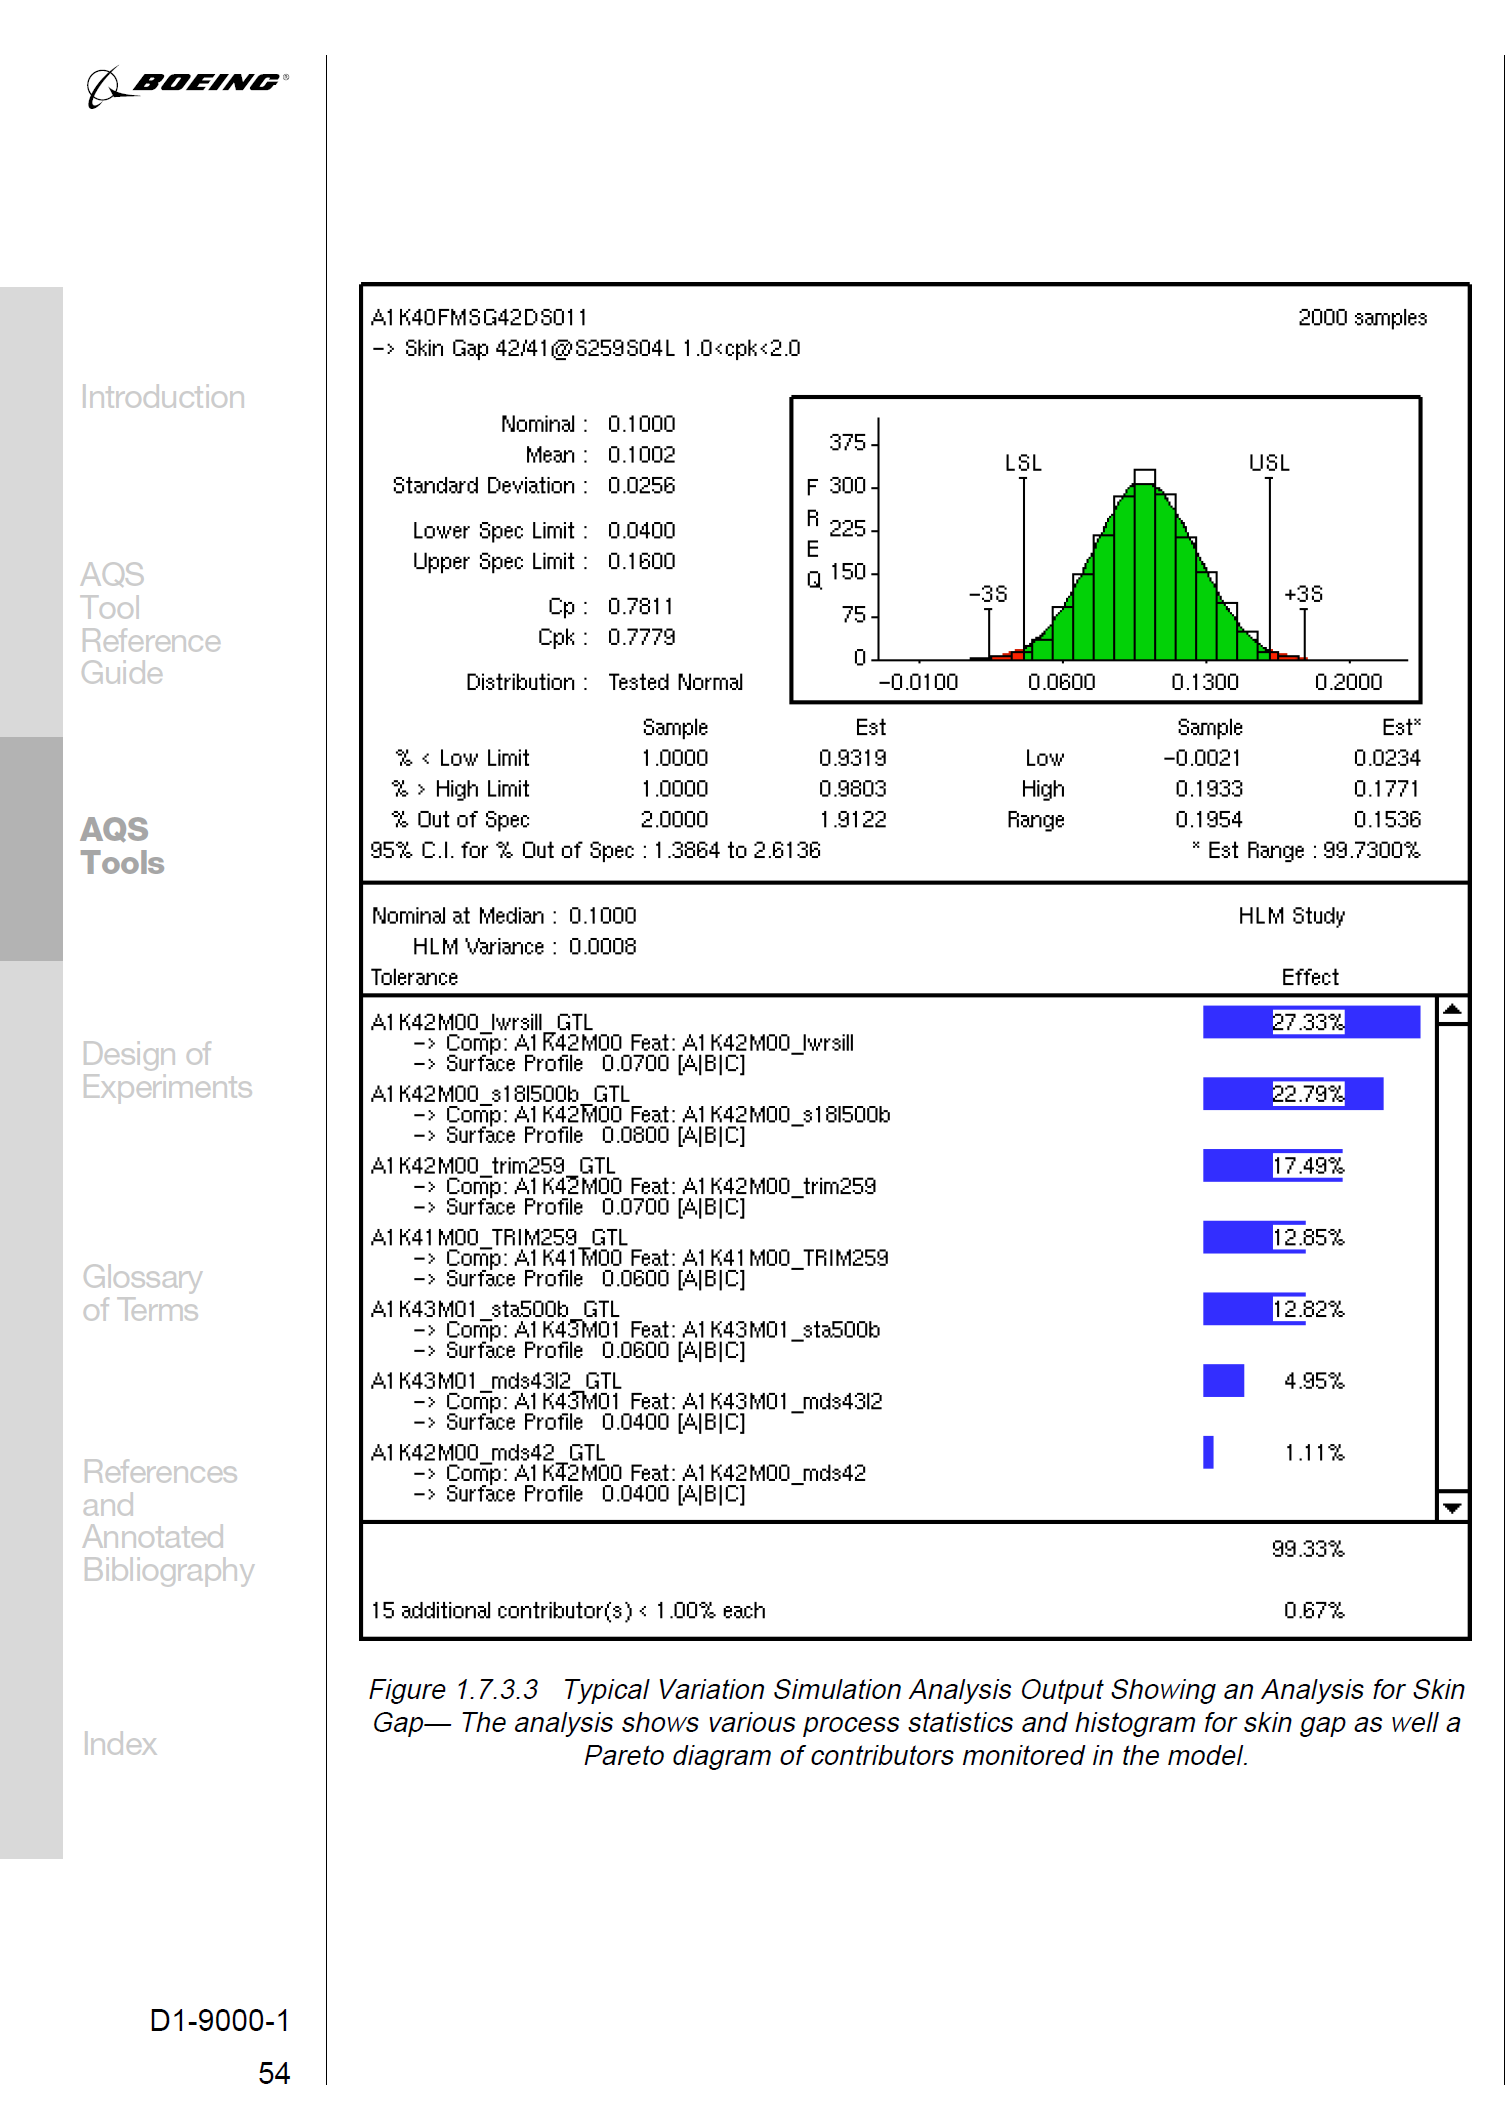
Figure 12. Two-dimensional (2D) statistical variation analysis in the field of GD&T (Geometric dimensioning and tolerancing). Page from The Boeing Company booklet "Advanced Quality System Tools" | "Advanced Boeing Quality System Tools", 1998.
Moreover, even three-dimensional (3D) statistical variation analysis in the field of GD&T (Geometric dimensioning and tolerancing) has long been used in leading Western companies.
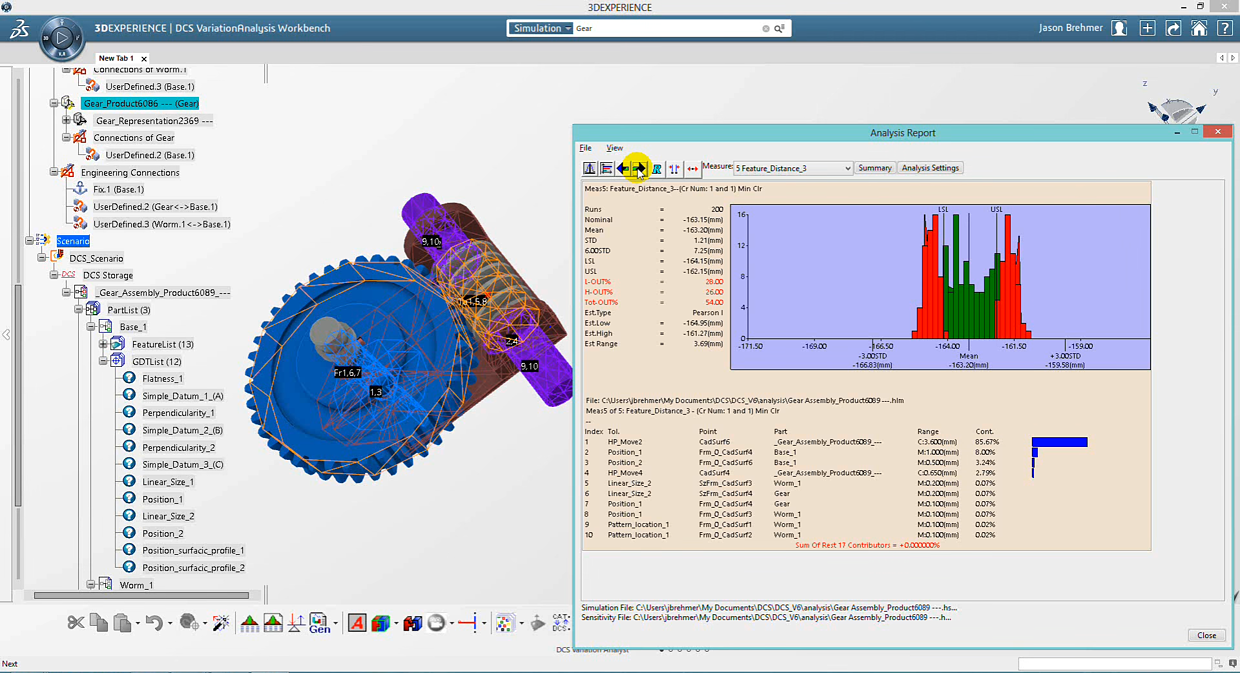
Figure 13. Three-dimensional (3D) statistical variation analysis in the field of GD&T (Geometric dimensioning and tolerancing). Software product 3DCS Variation Analyst of the American company Dimensional Control Systems Inc. used as a tool integrated into CAD CATIA V5, SOLIDWORKS, CREO, NX, 3DEXPERIENCE, as well as as a stand-alone tool.
These companies use automated simulation tools in the field of GD&T (Geometric dimensioning and tolerancing) to verify the correct alignment of tolerance fields in the digital model. So, for example, in the publication [22] The Boeing Company "Advanced Quality System Tools" (page 51) from 1998 describes the purpose and operating principle of Three-Dimensional Statistical Variational Analysis. See the discussion of this issue in more detail in the document [23] Boeing Company report ISSTECH-95-030, Tolerance Stack Analysis Methods, authored by Fritz Scholz (1995) in section bibliographies our site.
And they may make mistakes
Although 3D statistical variation analysis is the next step towards understanding the variability of the designed products (digital model), it is an advanced sub-optimization because it is not related to the actual variability of production processes.
Weaknesses of 2D, 3D statistical variation analysis
1. Processes may be in a statistically uncontrollable (unpredictable) state, which makes such an analysis purely theoretical.
2. The spread of controlled characteristics of stable processes can operate wider than the tolerance zone or go beyond the tolerance zone. If, at the same time, production management decides to save some of the products that fall outside the tolerance limits, for example, by lowering its “quality class,” variation analysis will not give an idea of possible options for pairing such parts.
3. The spread of the controlled characteristics of stable processes can operate within the tolerance range, then you will be pointlessly making calculations of options that will not happen in reality.
4. Processes may be poorly centered in the tolerance field, then there is a risk of making mistakes from paragraphs 2 and 3 above.