Costly problems associated with the use of random quality inspection tables
The use of quantitative and alternative sampling standards does not provide an idea of the controlled lot and misleads suppliers and consumers.
Article prepared by: Scientific Director of the AQT Center Sergey P. Grigoryev
Free access to articles does not in any way diminish the value of the materials contained in them.
“One of the obstacles to transformation: The use of tables for carrying out random acceptance inspections, because they cannot be adapted to the goal of minimizing the average total cost of inspection of incoming materials and the consequences of allowing defective materials into production.
If the degree of statistical controllability of the quality of incoming materials is high, control of samples would not provide insight into the remainder of the controlled lot, due to the lack of evidence of correlation between them in this case."
The meaning of Edwards Deming's quote, that sampling control does not give an idea of the rest of the controlled batch, can be confirmed by Edwards Deming's experiment with red beads , in which random mechanical samples from a mixture of red and white beads in the vast majority of cases give a value for the proportion of red beads that differs from the real proportion of red beads in the mixture, either higher or lower. Only a few mechanical samples hit the average proportion of red beads (1/5) in the mixture. It is important to note here that we knew about the composition of the mixture before the experiment began. In real practice, you do not know this number.
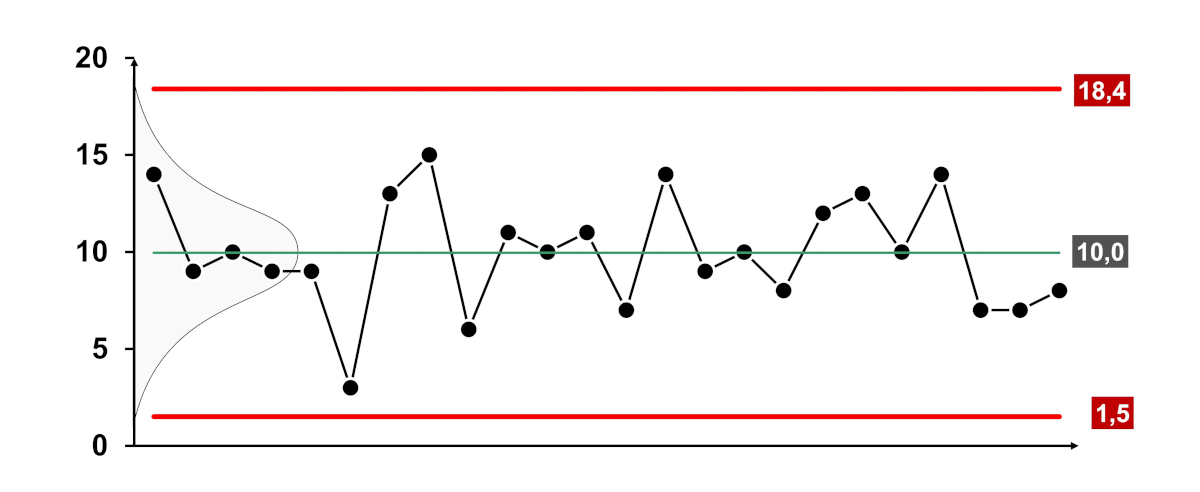
Rice. Control np-card of the experiment with red beads, conducted at a training seminar by S. P. Grigoryev in 2011.
The reason presented above is sufficient for a widespread revision of the rules for acceptance control of incoming batches.
I know of a case where the use of selective acceptance quality control tables made it possible to accept a batch of critical parts along with defective ones, the use of which led to a serious accident with casualties and image losses for the enterprise and even the entire industry of one country.
Anyone who is involved in the shipment of finished products is familiar with anecdotal situations when the same batch of goods, not accepted by the consumer upon first delivery, is accepted by him upon repeated delivery. The reason for this phenomenon is explained above.
"The main problem... is the unwise use of these (acceptance) plans in situations where they are not applicable."
With the exception of the sampling inspection tables, other requirements of the acceptance inspection standards could be applied to the processes of suppliers and buyers, to control the quality of suppliers according to the rule " all or nothing ", but how many companies today are able to meet them?
Analysis of the requirements of sampling standards
As a person with an engineering education, I experience cognitive dissonance when measurement data (continuous quantities, measured characteristics, individual values) in GOST standards for selective acceptance control are called “quantitative characteristics”, and calculation data are called “alternative characteristics”. What does the word "quantity" have to do with the characteristics being measured? Did the people who translated the ISO standard care about its intended use with minimal confusion?
In the vast majority of cases of application of sampling acceptance inspection standards, the mandatory requirements (conditions of application) of these standards for the “effective operation of sampling inspection plans” are ignored. Judge for yourself.
GOST:
The inspection procedure must be applied to a continuous series of batches consisting of discrete units of product supplied by a single manufacturer using a single production process. If there are several manufacturers or production processes, this standard should be applied separately to each manufacturer or process (Source: GOST text, see list below the article);
A comment:
Does the party performing incoming inspection have any idea what the supplier's "process" is in this case? The production of any operation identical in name in a general process, for example, on different machines or from different batches of raw materials, can serve as the basis for such a division of a continuous series of batches within the process (by batch of raw materials, machine, machine operator, etc.). Without analyzing the process using Shewhart control charts for product uniformity, you will not be able to know this. Even control charts can demonstrate the homogeneity of heterogeneous products if all controlled products come from different but stable processes and are well mixed in the overall mixture.
At the same time, the Shewhart control chart, used with an understanding of the context, allows us to operationally accurately define the very concept of detectability of “various processes”. But there is not a word about this in the guest.
GOST:
Quality measurement system:
- the measurement method is unbiased, i.e. the mathematical expectation of the measurement error is zero;
- the measurement error creating the observed process variation is independent of the actual process standard deviation;
- the measurement error follows a normal distribution;
- it is known that the ratio of the standard deviation of measurement error to the standard deviation of the process is less than 0.1, otherwise sampling plans must be used with the changes specified in the standards;
A comment:
This is the simplest requirement of sampling standards, since for the most part it is the responsibility of the receiving party. The receiving party has such information about its measurement system ?
Does the monitoring party's measurement system meet these requirements? To meet the final 1/10 ratio requirement, you must know the standard deviation of the process that produces the controlled product characteristic at the supplier. But if the supplier's process is in a statistically uncontrolled state, the calculated standard deviation cannot be used in this case. Has the supplier provided you with Shewhart control charts confirming the stability of its processes associated with the production of the supplied products?
The requirement for a complete absence of bias in the measurement method is generally absurd. There is always a bias in the measuring system! The significance of this measurement system bias for the purposes of using the measurements obtained with that measurement system is questionable.
Donald Wheeler in article [33] "Consistency Diagrams, SPC for Measurement Systems." provides a description of a simple procedure for determining the detectability of this bias for the purposes of statistical process control, which is implemented in our software . But the displacement of the measuring system for product acceptance relative to the tolerance limits will have a completely different meaning. Therefore, we have implemented in our software the possibility of shifting the tolerance field towards the identified displacement of the measuring system.
At the same time, we did not find a word about the requirement for consistency between the measuring systems of the supplier and the consumer. This question is important because, in addition to issues of stability as well as bias in the supplier's and consumer's measurement systems, they are likely to have different errors (standard deviations) of the measurement systems. In addition, it should be understood that the obtained values of repeated measurements of the same product will have different values within 6 sigma of error, even for one measuring system with a distribution density of repeated measurements (test-retest) close to normal.
For an explanation of what should be done, see the open decision on the article by Donald Wheeler: " Is the product meeting the specification (approval) actually meeting the specification? Are defective products really defective? ". The recommendations in this article are also implemented in our software.
GOST:
In the case of several quality characteristics, they are independent of each other (Source: GOST text, see list).
A comment:
Is the receiving party aware of this “independence”? What source of information do you use? What data do you have?
GOST:
The production of supplied materials is sustainable and in a statistically controlled state (Source: GOST text, see list).
A comment:
How does the receiving party know about the statistical state of the supplier's (manufacturer's) process? What source of information do you use? What data do you have? The supplier provides you with each batch of Shewhart control charts of production processes for controlled quality parameters, indicating the stability of its processes, and your sample assessments confirm the information displayed on the supplier’s control charts?
GOST:
When using a sampling plan based on a quantitative characteristic, the measured values must obey a normal or close to normal distribution (Source: GOST text, see list).
A comment:
How does the receiving party know about the normality of the distribution of measured quality characteristics of the supplier (manufacturer)? What source of information do you use? What data do you have? What does "close to normal distribution" mean? See article about operational definitions .
After all, if the supplier’s process is in a statistically uncontrollable (unpredictable) state, there is no point in talking about its reproducibility and the normality of the distribution of the measured value. Moreover, in real practice, no one knows the true form of the distribution of individual measurement values. For example, processes with limited living space lack distribution symmetry ( for example, in the case when there is no lower control limit on the Shewhart control chart). Moreover, for statistical process control using Shewhart control charts, the type of distribution is not important - this is one of the robustness properties of control charts.
GOST:
The use of quantitative sampling is applicable to continuous production of a long series of batches, but is not recommended for individual batches. For individual batches or a short series of batches, it is more effective to use alternative control plans, with each batch consisting of units of the same type, class, size and composition, produced under essentially the same conditions during the same period of time (Source: GOST text, see list).
A comment:
How does the receiving party know about “virtually the same conditions during the same period of time”? What source of information do you use? What data do you have? Have you and the supplier agreed upon a clear and unambiguous operational definition such "sameness"? Often the supplier himself has no idea about this.
GOST:
Sampling procedures should not be applied to lots that have undergone preliminary screening with replacement of non-conforming units of product (Source: GOST text, see list).
A comment:
Is the receiving party aware of such “sorting” by the supplier before shipment? What source of information do you use? What data do you have? Often, with the best of intentions, a supplier will try to reduce the percentage of defective products in a batch by sampling defective products before shipment.
GOST:
Sampling inspection does not imply that a supplier may knowingly supply non-conforming units of product (Source: GOST text, see list).
A comment:
Can the receiving party be aware of the supplier's "knowing supply of non-conforming product"? What source of information do you use? What data do you have?
I am familiar with cases of deliberate mixing of defective products into a batch with good ones. After all, the resultant of such a reasonable mixture of good and bad products in this case should not exceed the “maximum permissible level of nonconformities, the acceptable quality limit (AQL, acceptance quality limit).”
What to do instead of using tables for random acceptance inspection?
The best solution would be to use a control plan for incoming raw materials, supplies and components." all or nothing ".
In any case, we must do everything to ensure that not a single defective (non-conforming) product reaches your customer. To reduce the overall total cost of producing quality products, continually improve all processes by understanding their interdependence. The “all or nothing” control rule for incoming materials serves only to minimize the company’s average total costs for rejecting incoming materials, for which a decision should be made on 100% control of the entire batch of incoming materials or passing such a batch to production with subsequent replacement and rework of defective products, formed as a result of such a pass by acceptance without incoming control.
"Once your product reaches the customer, the immediate cost of repair and replacement is only a small fraction of the cost of the defect. The loss of future business due to a dissatisfied customer or a potential customer who learns of the incident can be enormous and unfortunately impossible to estimate." .
If your current relationship with a supplier does not give you a reliable idea of the stability of its processes, and you do not have your own supply history data, use 100% verification (non-destructive testing only) to quickly accumulate such information. Insist on the supplier providing control charts of its processes with each shipment. If he doesn't know how to do it, teach him. At the same time, collect data on the supplier's batches in-house when accepting batches of materials, build control charts and judge the stability of its processes based on controlled quality indicators and the average proportion of defective materials, this will allow you to move on to a control plan " all or nothing ".
"The state of statistical control has a clear advantage. To find out whether the incoming flow of batches meets condition 1 or condition 2 of the all-or-nothing rule or is in a state bordering on chaos, you only need to track statistical control and the average percentage of defective products using charts, built on ongoing small sample testing (as in any case), preferably in collaboration with and on the supplier's premises."
Build relationships with a supplier interested in cooperation that will allow you, over time, although this will not happen in the near future, to completely abandon incoming control. Until this moment, do not be left without information; build your own control charts of the quality parameters of incoming materials. This will give you an additional advantage in negotiations with such a supplier.
GOST list of random quality control procedures
GOST R ISO 3951-1-2015
Designation English: GOST R ISO 3951-1-2015
Russian title: Statistical methods. Sampling procedures based on quantitative characteristics. Part 1. Requirements for single-stage plans based on AQL when inspecting successive lots using a single characteristic and a single AQL
English title: Statistical methods. Sampling procedures for inspection by variables. Part 1. Specification for single sampling plans indexed by AQL for lot-by-lot inspection for a single quality characteristic and a single AQL
GOST R ISO 3951-2-2015
Designation English: GOST R ISO 3951-2-2015
Russian title: Statistical methods. Sampling procedures based on quantitative characteristics. Part 2. General requirements for single-stage plans based on AQL when inspecting successive batches for independent quality characteristics
English title: Statistical methods. Sampling procedures for inspection by variables. Part 2. General specification for single sampling plans indexed by AQL for lot-by-lot inspection of independent quality characteristics
GOST R ISO 3951-3-2009
Designation English: GOST R ISO 3951-3-2009
Russian title: Statistical methods. Sampling procedures based on quantitative characteristics. Part 3: Two-stage AQL-based schemes for sequential batch inspection
English title: Statistical methods. Sampling procedures for inspection by variables. Part 3. Double sampling schemes indexed by AQL for lot-by-lot inspection
GOST R 50779.70-2018
Designation English: GOST R 50779.70-2018
Russian title: Statistical methods. Alternative sampling procedures. Introduction to the standards of the GOST R ISO 2859 series
English title: Statistical methods. Sampling procedures for inspection by attributes. Introduction to GOST R ISO 2859 series of standards
GOST R ISO 2859-1-2007
Designation English: GOST R ISO 2859-1-2007
Russian title: Statistical methods. Alternative sampling procedures. Part 1: Sampling plans for successive lots based on acceptable quality levels
Title in English: Statistical methods.Sampling procedures for inspection by attributes.Part 1. Sampling schemes indexed by acceptance quality limit for lot-by-lot inspection.
GOST R ISO 2859-3-2009
Designation English: GOST R ISO 2859-3-2009
Russian title: Statistical methods. Alternative sampling procedures. Part 3. Control with skipping batches
English title: Statistical methods. Sampling procedures for inspection by attributes. Part 3. Skip-lot sampling procedures
GOST R ISO 2859-5-2009
Designation English: GOST R ISO 2859-5-2009
Russian title: Statistical methods. Alternative sampling procedures. Part 5: AQL-based sequential plan system for sequential batch inspection
English title: Statistical methods. Sampling procedures for inspection by attributes. Part 5. System of sequential sampling plans indexed by AQL for lot-by-lot inspection
GOST R ISO 2859-10-2008
Designation English: GOST R ISO 2859-10-2008
Russian title: Statistical methods. Alternative sampling procedures. Part 10. Introduction to the standards of the GOST R ISO 2859 series
English title: Statistical methods. Sampling procedures for inspection by attributes. Part 10. Introduction to the GOST R ISO 2859 series of standards