Comparing averages with standards for individual measurements is ignorant. Examples of the widespread use of "average hospital temperature".
Material prepared by: Scientific Director of the AQT Center Sergey P. Grigoryev .
Free access to articles does not in any way diminish the value of the materials contained in them.
Data from Vodokanal of St. Petersburg on water quality and wastewater treatment for extracting knowledge and improving processes is completely useless and even harmful. Open data tables indicate “Standards” for individual measurement results, which are “successfully” compared with monthly averages.
Source of analyzed data: www.vodokanal.spb.ru
Unfortunately, it is pointless to analyze the open data of Vodokanal of St. Petersburg using any methods. Average monthly data hid all information about the processes. If Vodokanal management analyzes this data, it is misleading itself when drawing any conclusions. It is impossible to gain knowledge from this data.
The data represent monthly averages, as the arithmetic mean of all measurements obtained during the month (the number of such measurements and the range are unknown). The average values themselves are rounded to signs that hide the variability of the average monthly values themselves from month to month. Moreover, the open data tables indicate “Standards” for individual measurements, with which average monthly values are “successfully” compared, which has no practical meaning. In this case, the monthly average of individual measurements is similar to the average temperature in a hospital of 36.6 °C, where everyone is dying.
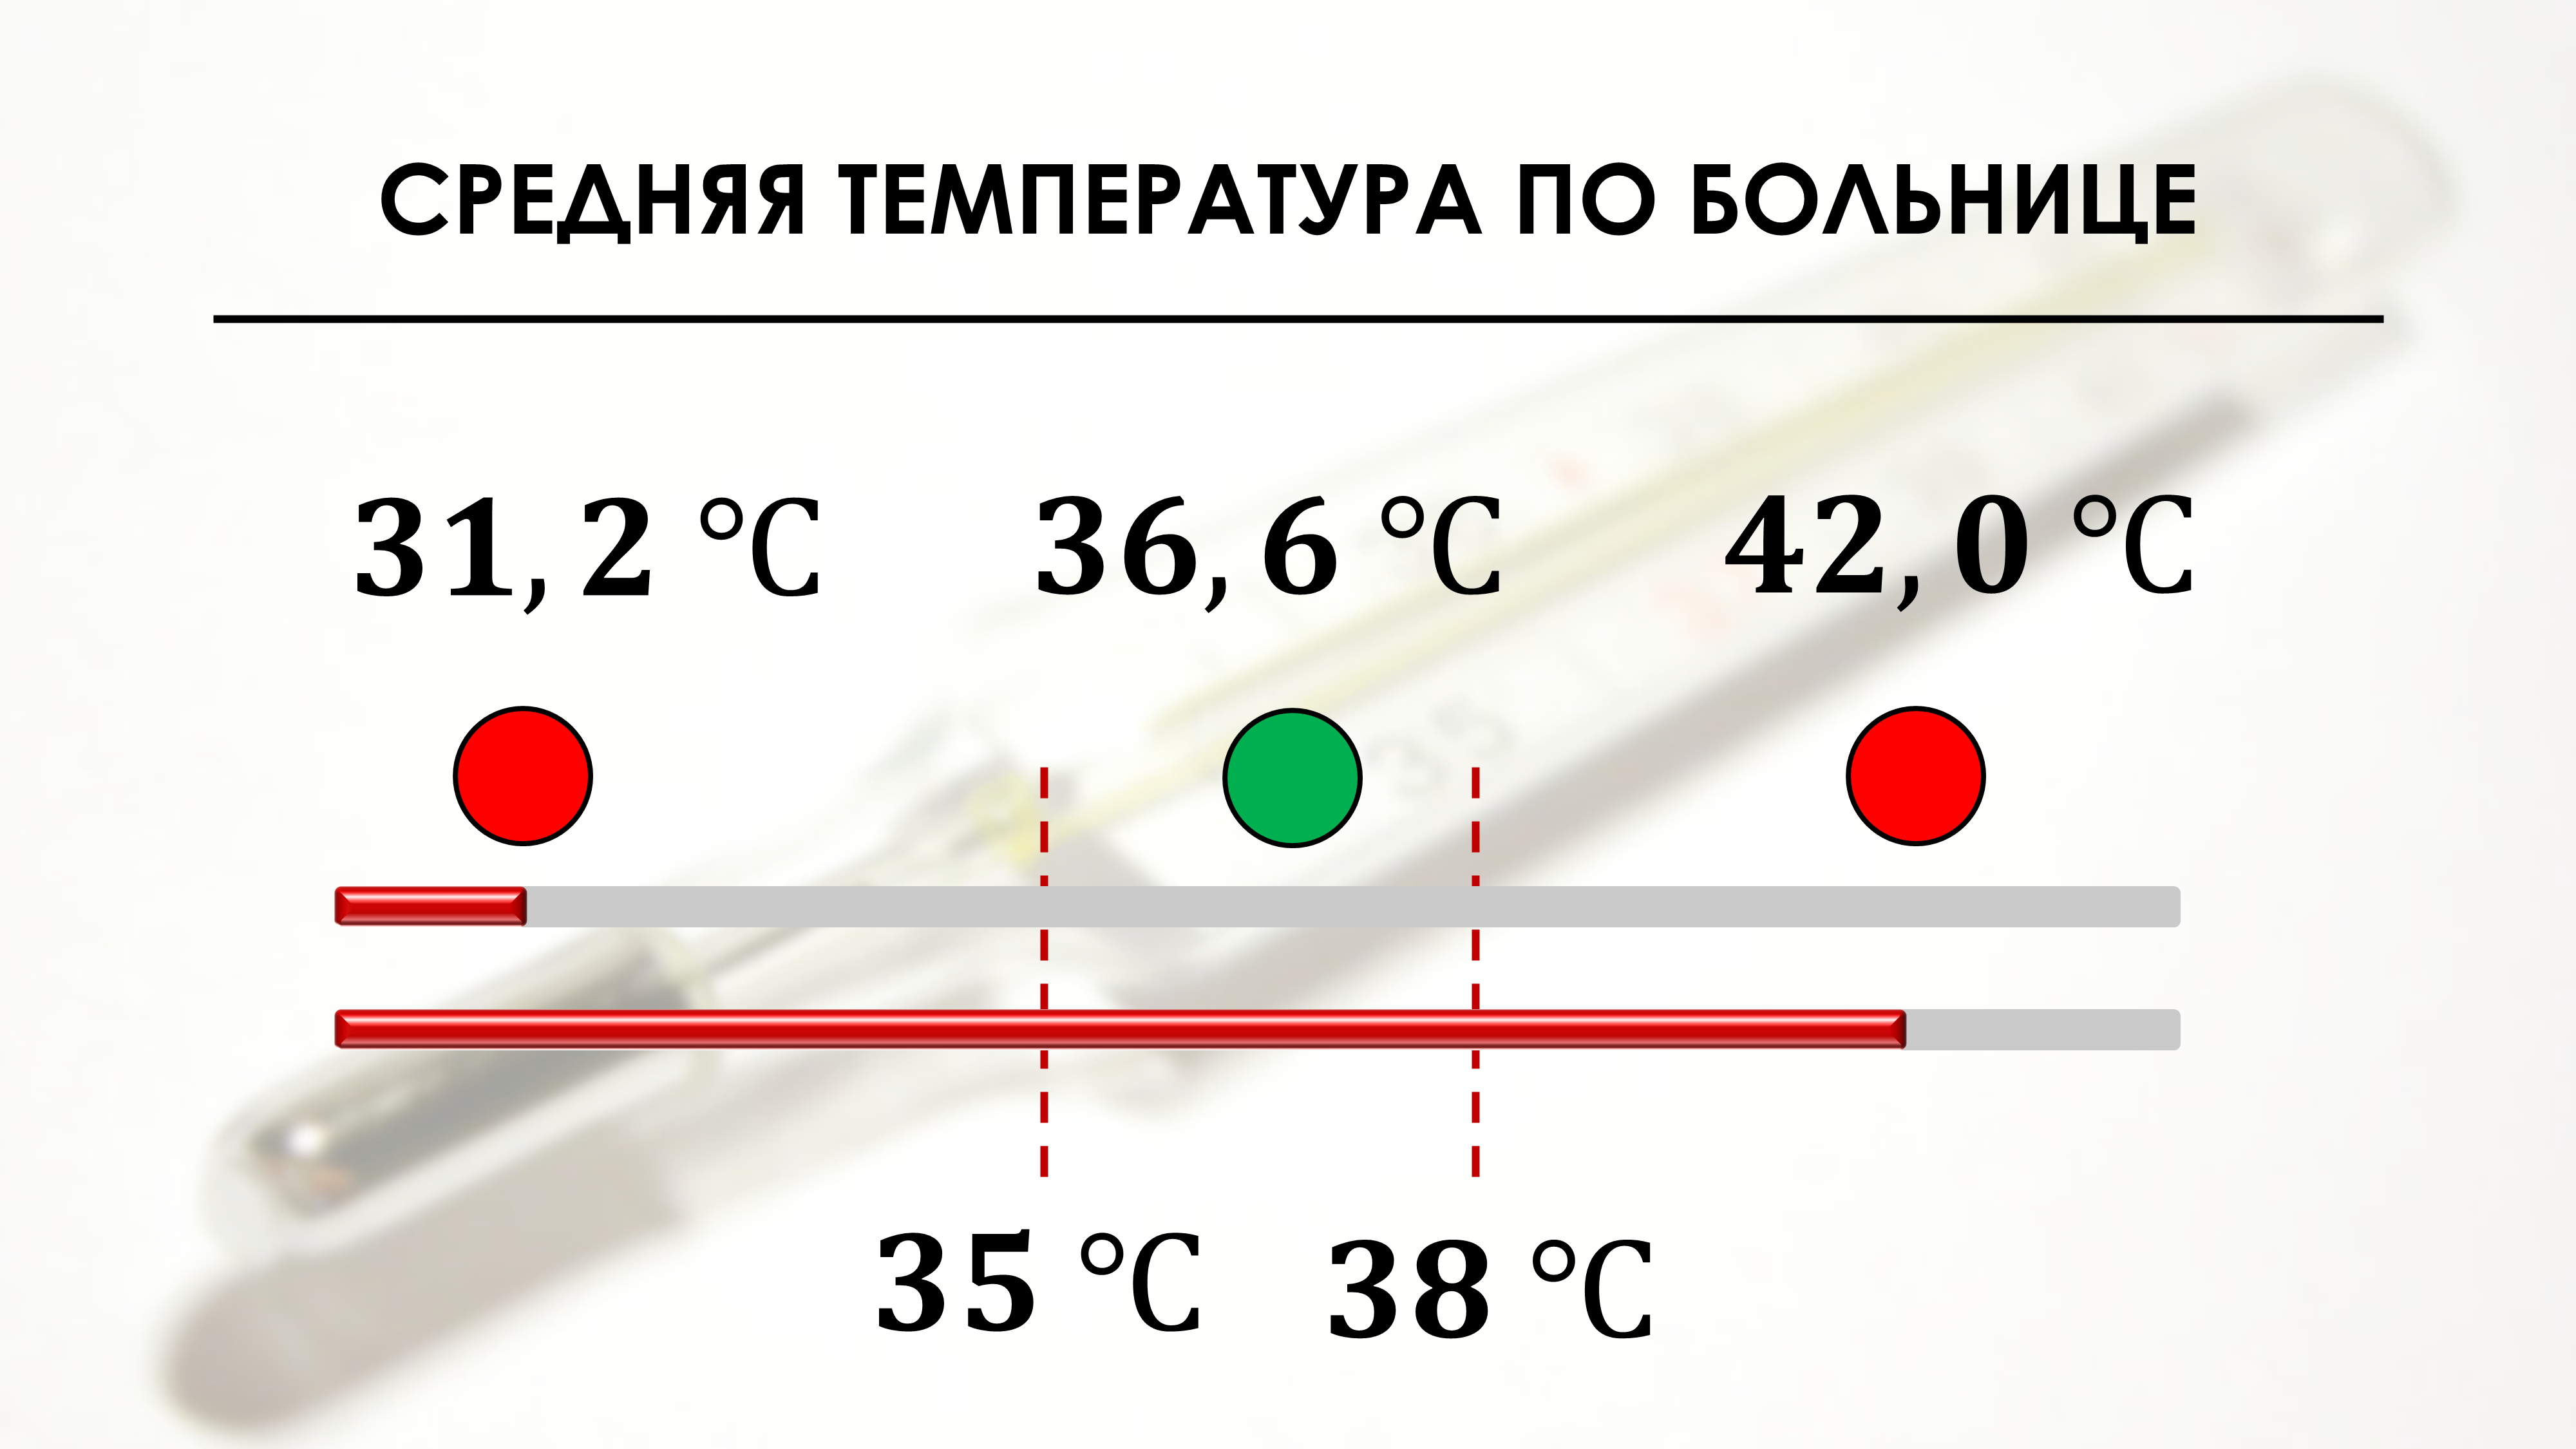
Figure 1. The average temperature in the hospital is 36.6 °C, with one half of the patients cooling down at death with an average temperature of 31.2 °C, and the other burning from high fever with an average temperature of 42 °C. The red dotted lines correspond to the temperature range of “mildly” ill people from 35 to 38 °C.
If in our hospital the average average temperature values: (31.2 °C + 42 °C) / 2 = 36.6 °C falls within the range of mildly ill people, and also corresponds to the temperature of healthy people, should we worry about them? Vodokanal of St. Petersburg, for example, is not worried, but it should be.
If you think this is a rare anecdotal incident, you are mistaken. We encountered a blunder similar to the one described above in the quality improvement software of a US IT company. In this software, Xbar control charts of average subgroups display the technical tolerance limits of individual values. The software products of this company, with gross errors embedded in them, are used by the most famous world-famous manufacturing companies.
We see the limits of technical tolerances on the control Xbar (X)-cards of average values of subgroups in most Russian companies that are trying to use Shewhart control charts after training conducted in these companies by unknown consultants. Such training programs and the Shewhart control charts used do more harm than good, increasing the company's overall total losses, including those losses that cannot be measured numerically.
For greater clarity, the animation below shows Shewhart control charts for individual values (XmR) versus subgroup mean and range (XbarR) charts with subgroup sizes n=4 and n=9, plotted for the same data series.
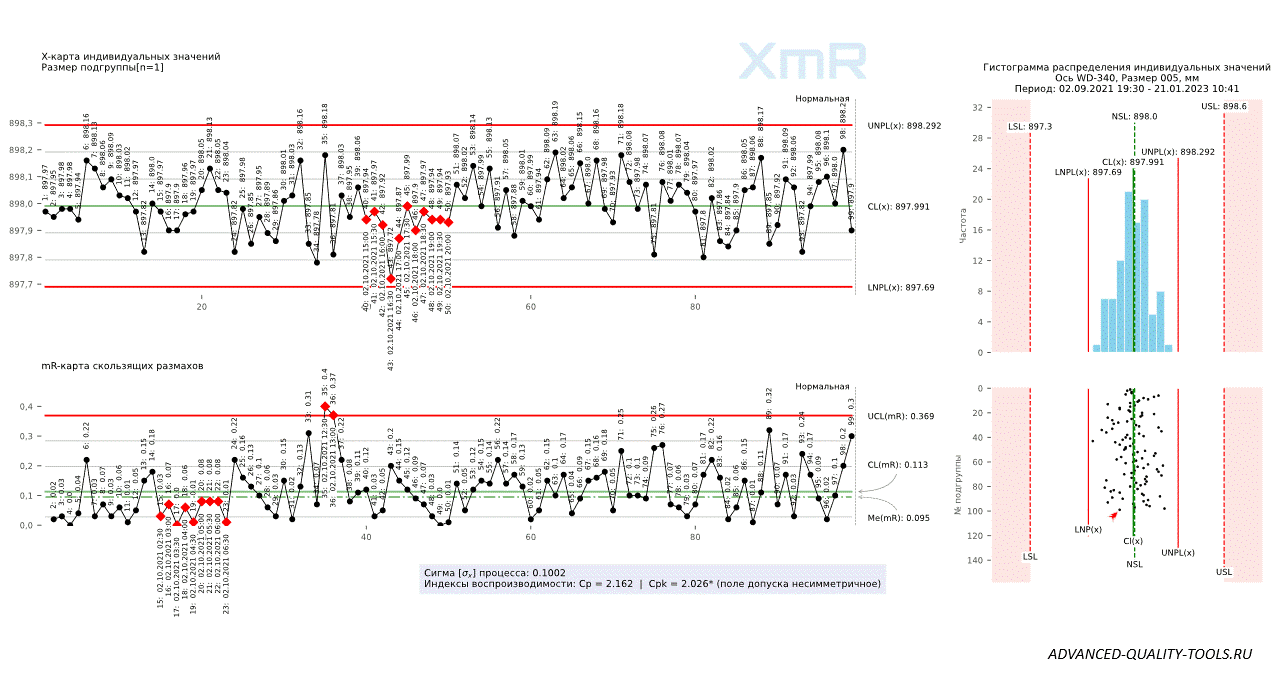
Figure 2. Shewhart control charts for individual values (XmR) versus subgroup mean and range (XbarR) charts with subgroup sizes n=4 and n=9, plotted for the same data series. Graphs prepared using Y-axis control chart scaling functions our cross-platform software “Shewhart control charts PRO-Analyst +AI (for Windows, Mac, Linux)”
"There is no substitute for knowledge. But the prospect of using knowledge is scary."