Bonuses or depreciations for company employees based on the results of the reporting period within the system are the same as rewarding for winning the lottery or punishing for losing
Material prepared by: Scientific Director of the AQT Center Sergey P. Grigoryev .
Free access to articles does not in any way diminish the value of the materials contained in them.

- How do we know who gets a raise if we don't have merit-based pay? - asked a seminar participant.
- The answer is simple: everyone working within the system, - answered Edwards Deming.
Below is Shewhart's control chart with an explanation of Edwards Deming's answer to the seminar participant (see quote above), which demonstrates the distribution of company employees working “within the system” and “outside the system”, with both the best and worst results.
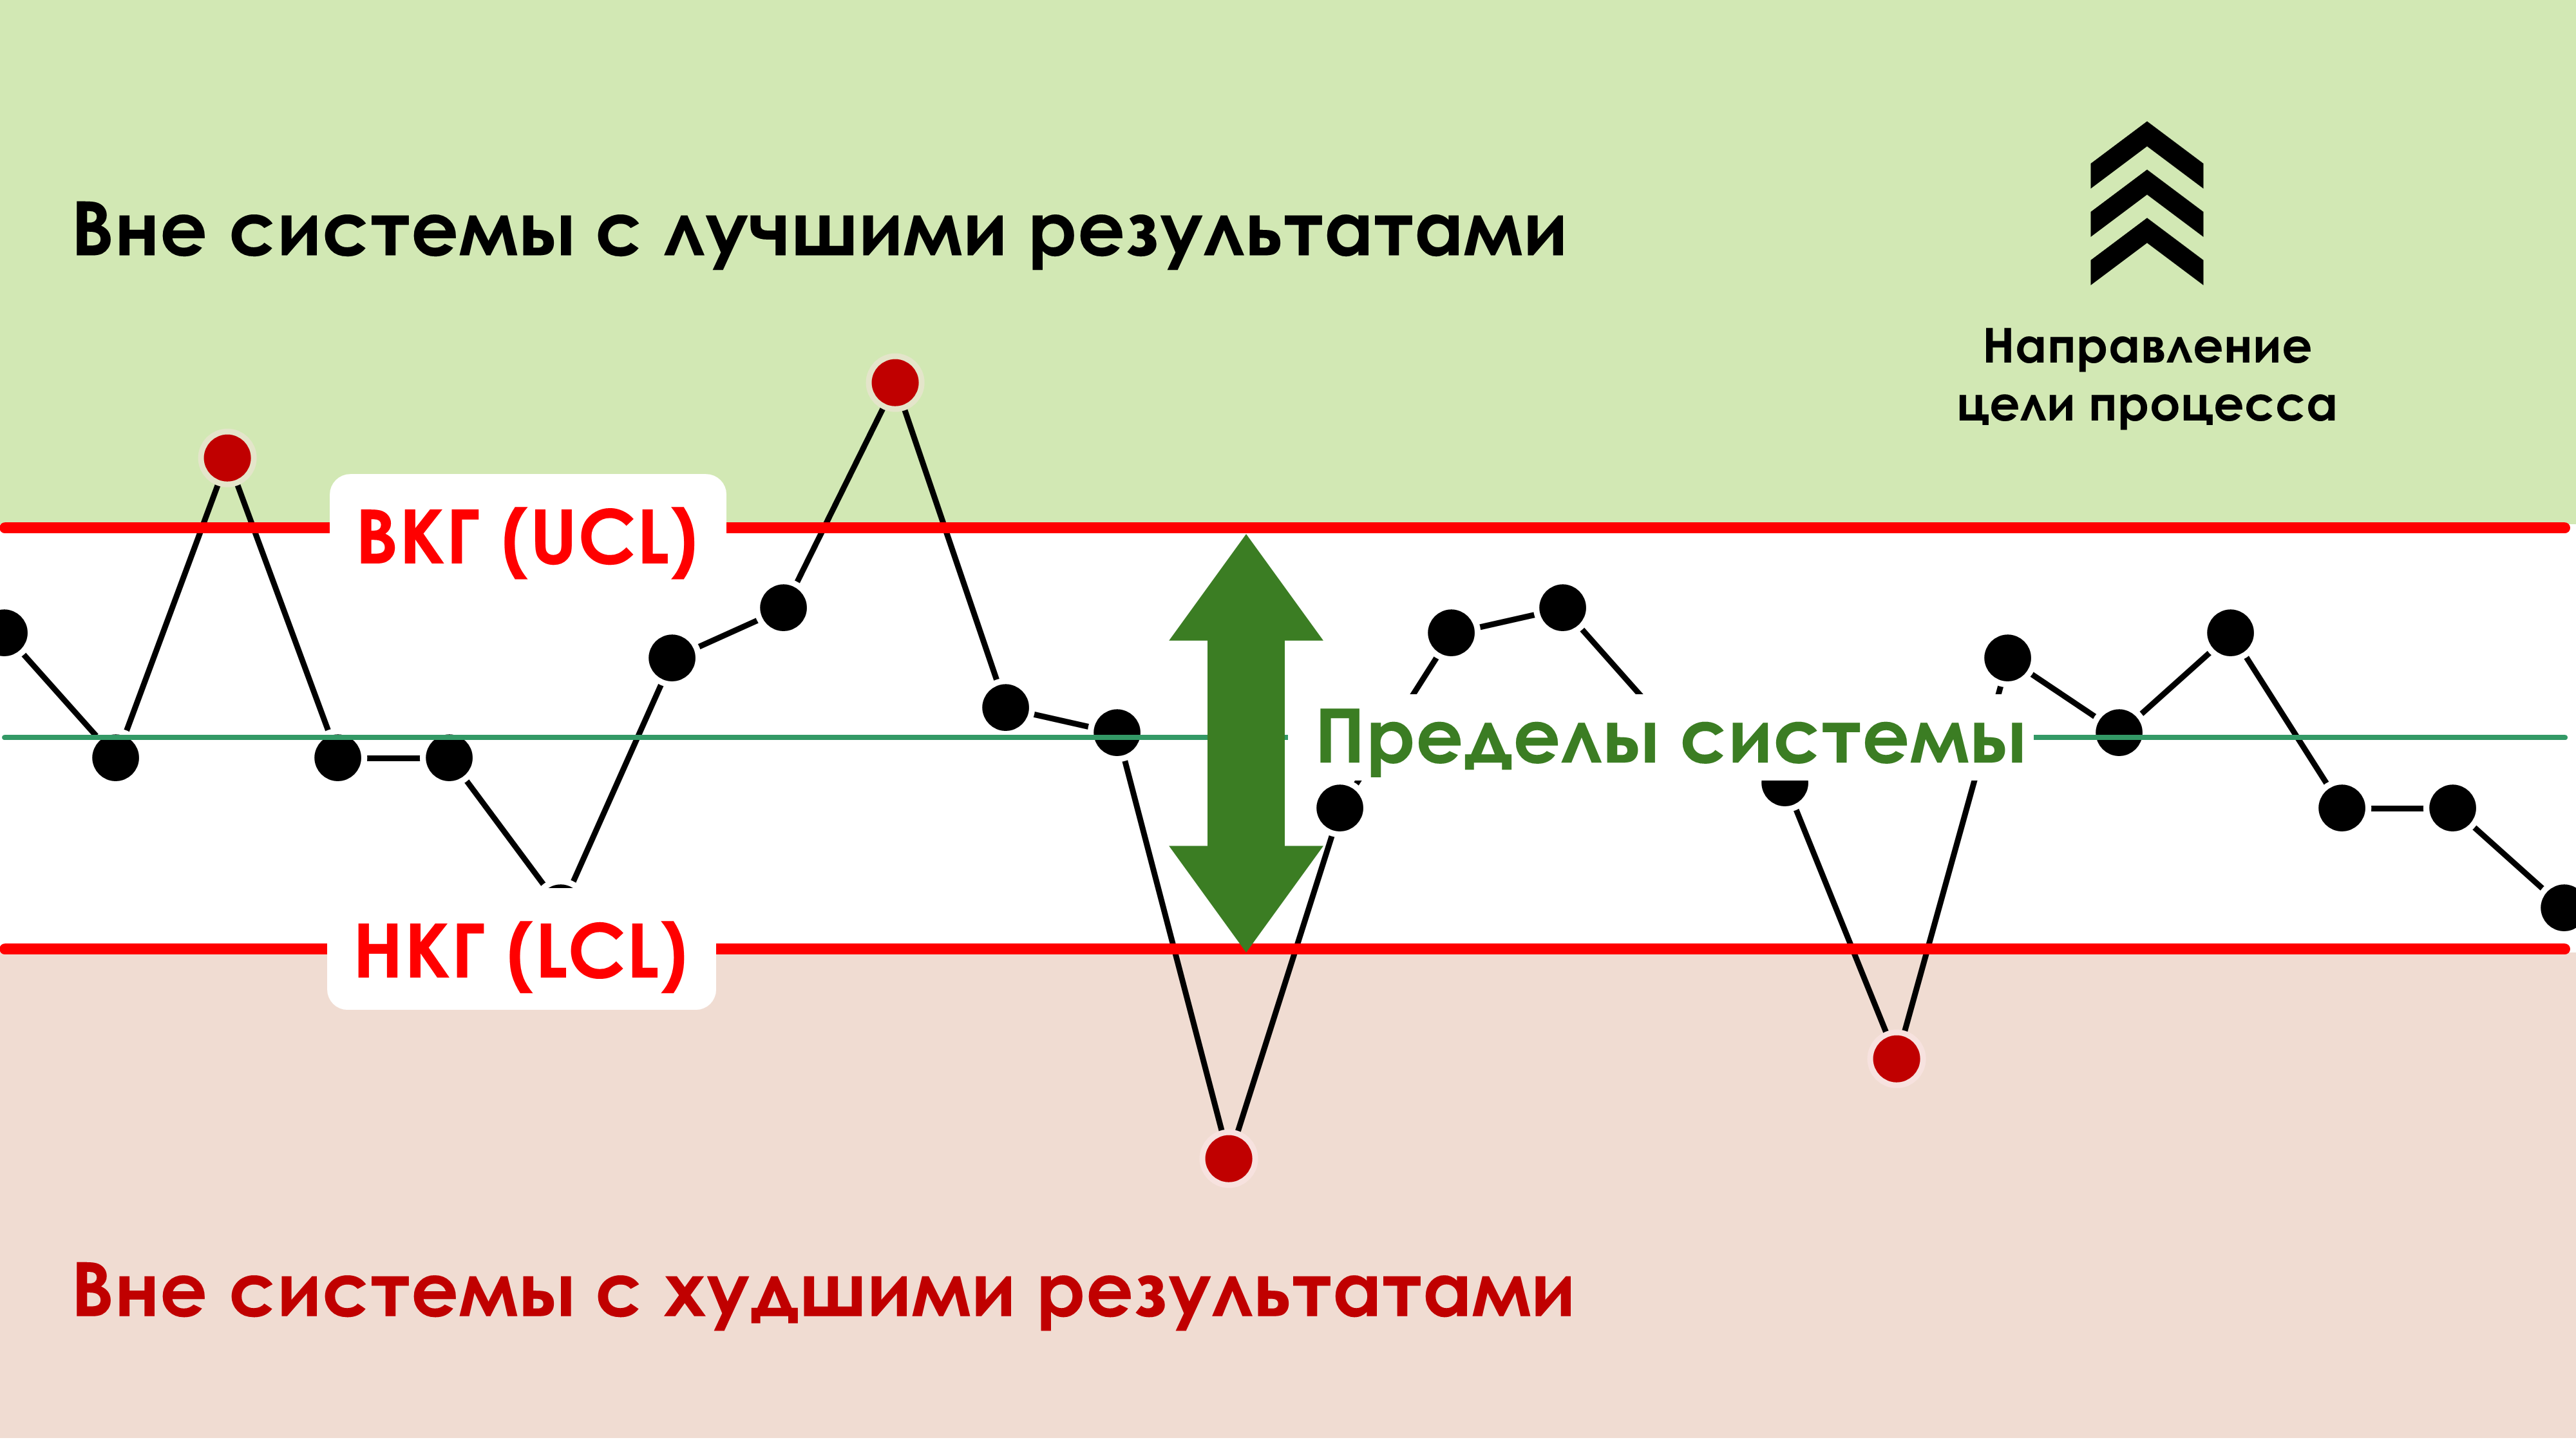
Figure 2. System limits in terms of Shewhart control charts.
Case Study
In one of my projects, after numerous training seminars (on Edwards Deming's management theory and statistical process control), with company management, I came across the case described below.
One of the managers was preparing a document for senior management to award bonuses to employees of his division who, in his opinion, achieved, in the reporting month (April 2012), a significant improvement in an indicator important for the company. When I asked what data he used to make his judgment about award-worthy success, I was presented with a table with data for reporting months for the period since July 2011. to April 2012 The number in the April 2012 data cell was the largest in 2012. This leader was present at all our training seminars.
“Resistance to knowledge is still strong in people. The type of transformation that Western (read, Russian – Note by S.P. Grigoryev) industry needs involves expanding knowledge, and yet people continue to resist them.
Pride is not the last factor in this struggle. After all, new knowledge that comes to the company can reveal our mistakes. The best approach is to pursue new knowledge because it can help us do better."
I suggested that this manager use a specially prepared form to construct a control chart of individual values and moving ranges to assess the statistical state of the system generating the analyzed data. It took him no more than 1 minute to build a control XmR-chart, see Fig. 3.
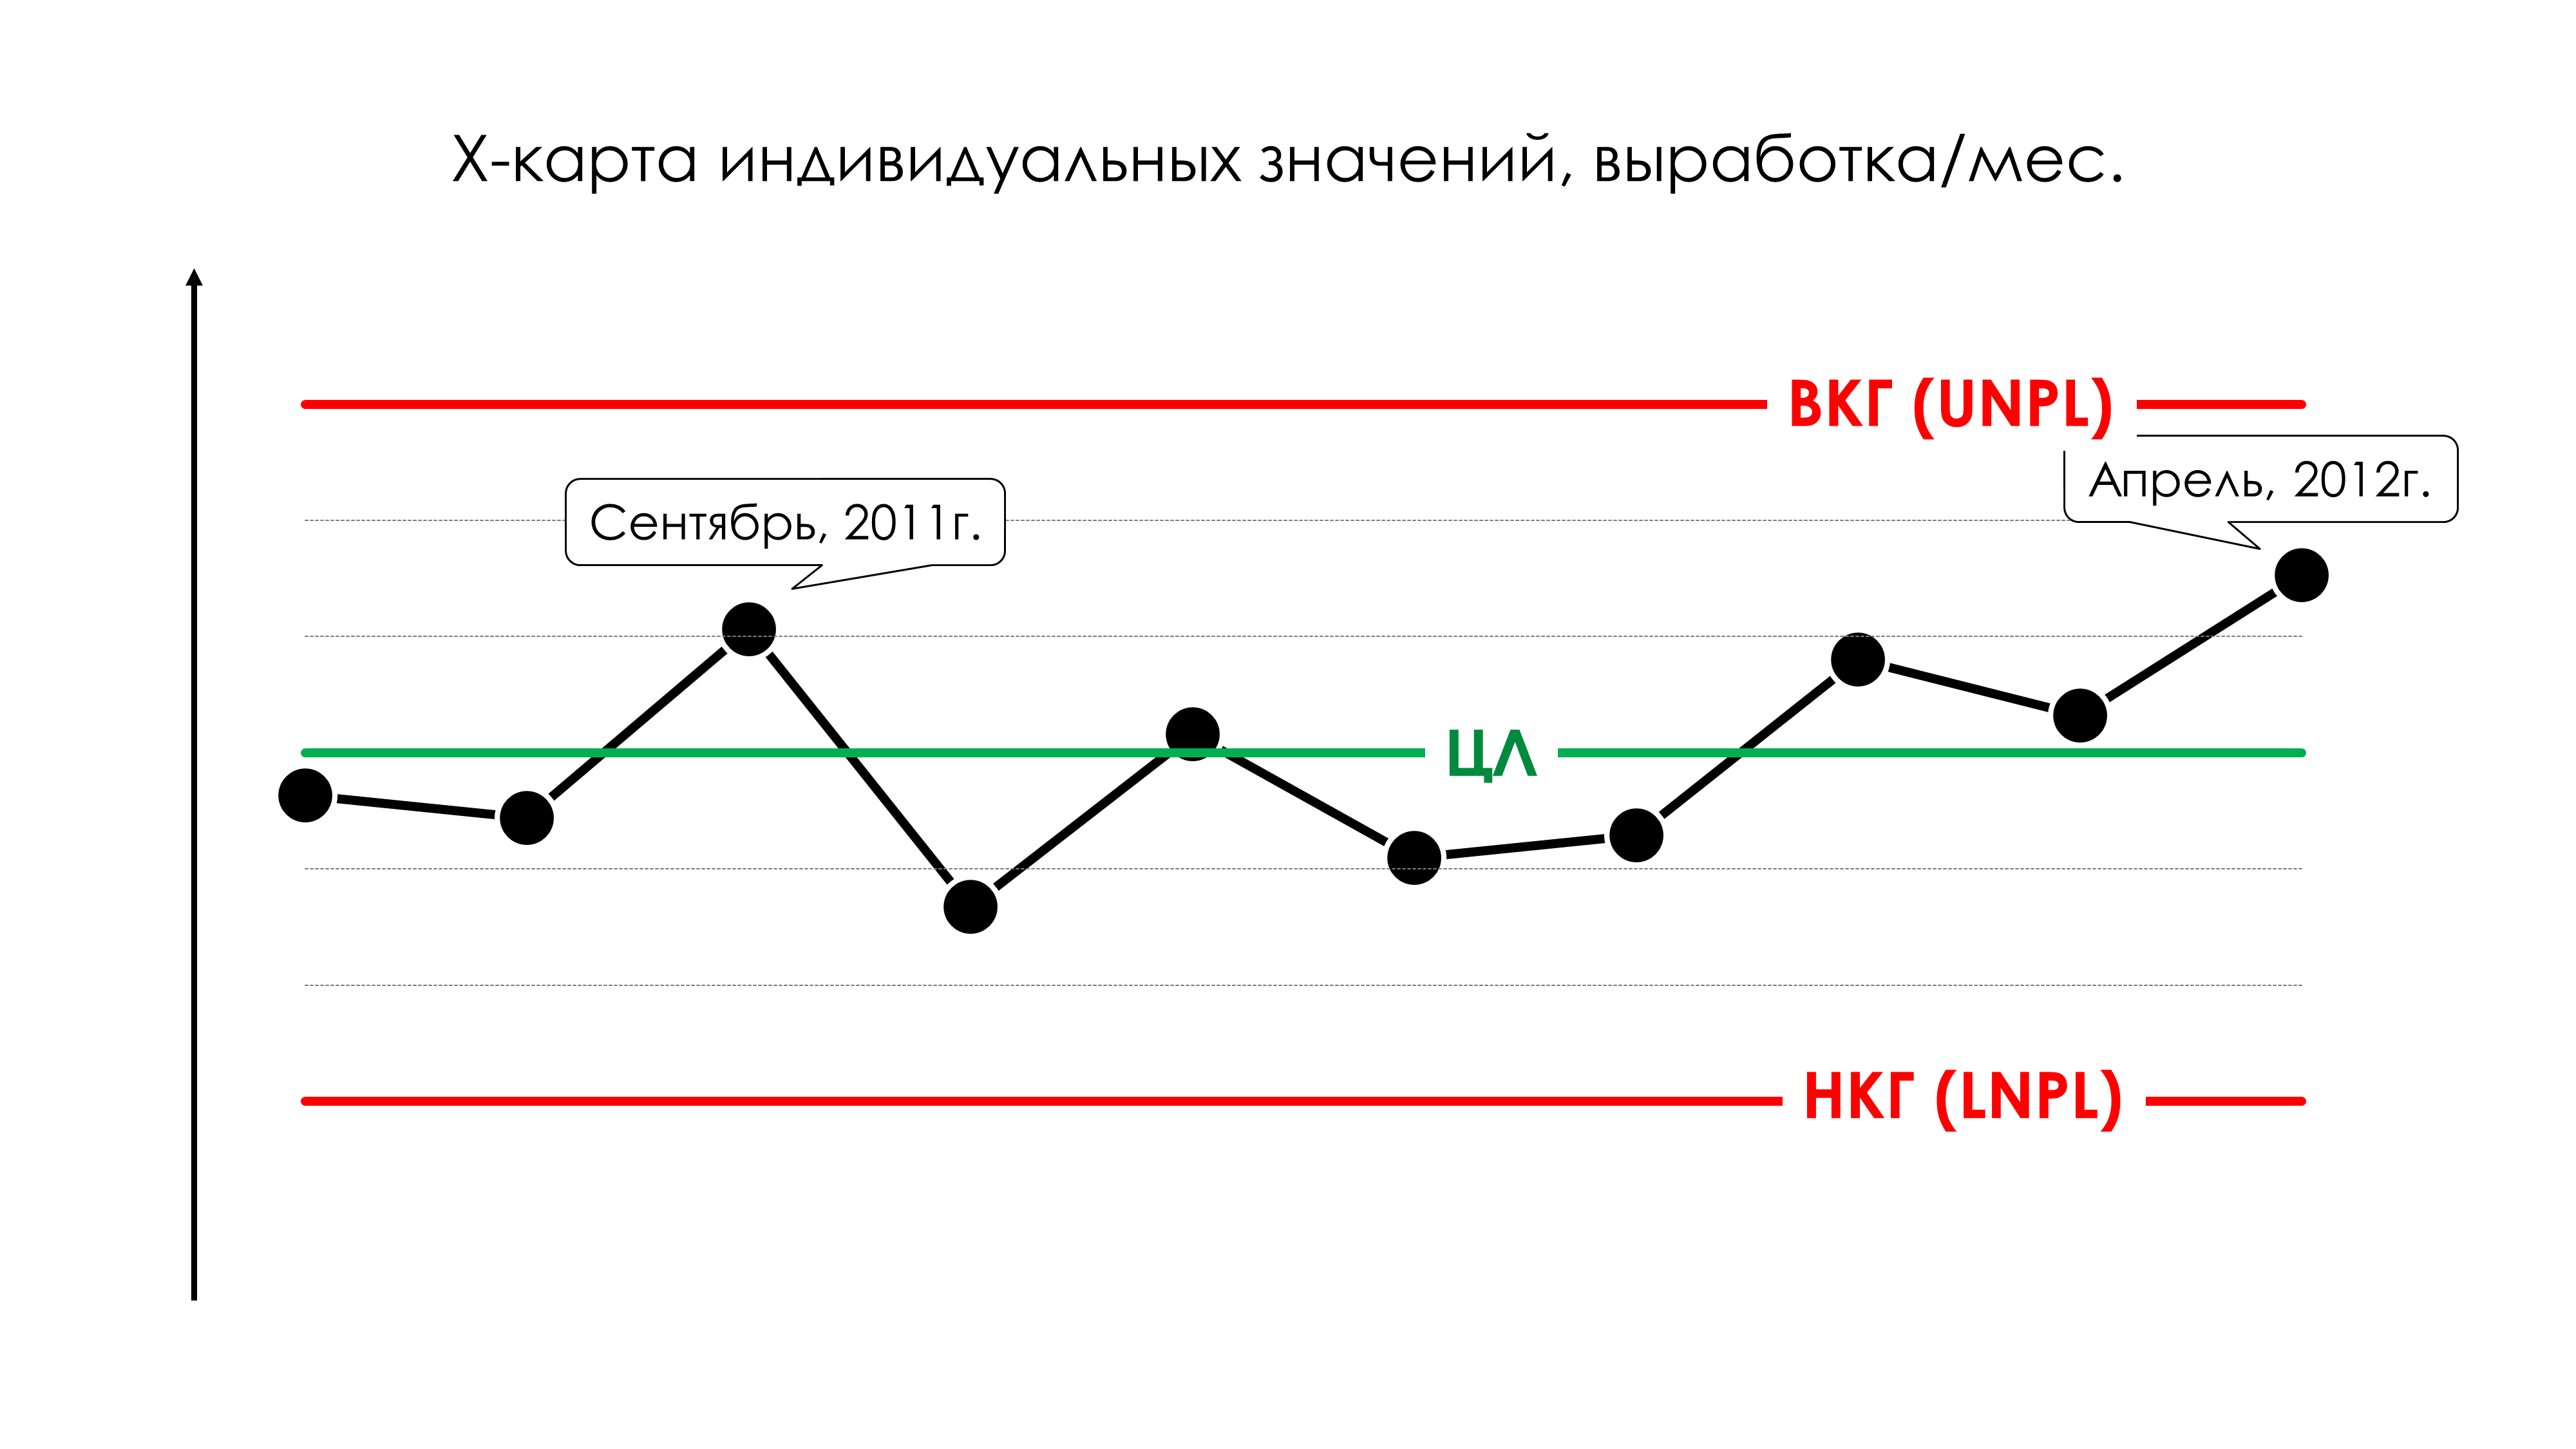
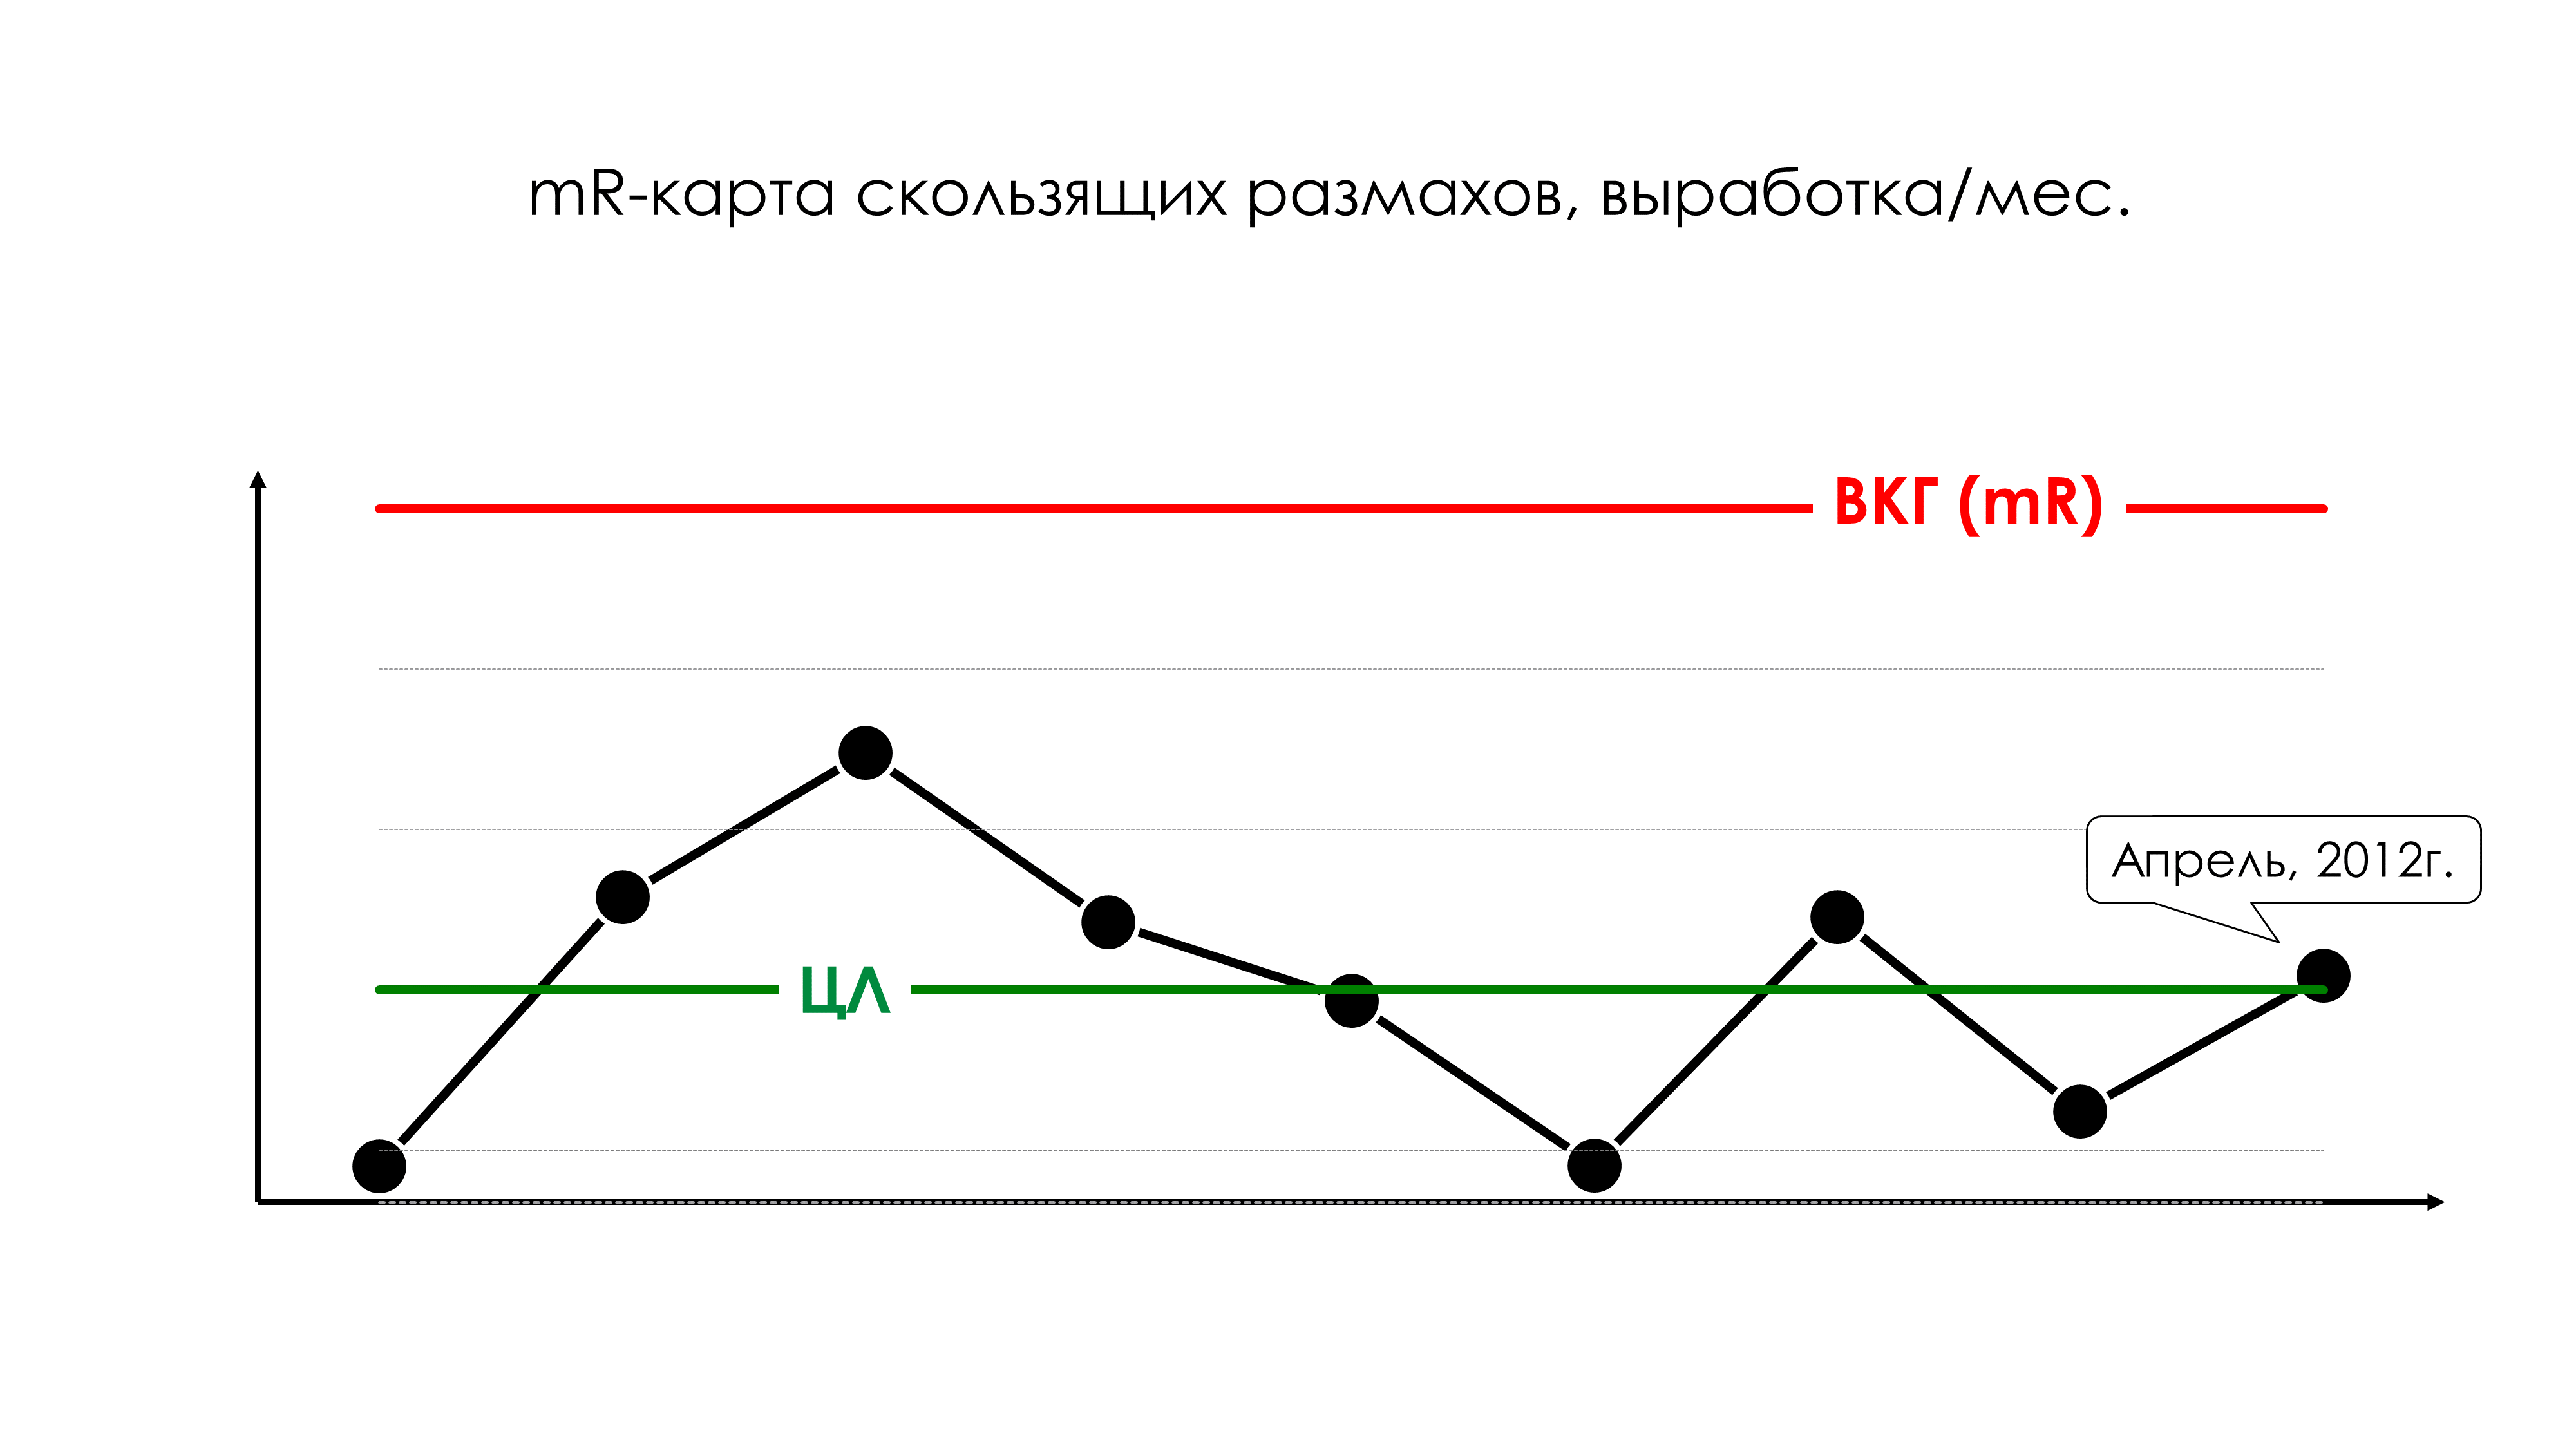
Figure 3. Shewhart control chart of individual values (XmR map). Literature: For rules for constructing Shewhart control charts, see GOST R 50779.42-99 (ISO 8258-91) - [11.1] Statistical methods. Shewhart control charts.
From the XmR-chart (Fig. 3) it is clear that the system is in a statistically controlled state - all points are located within the calculated control limits (6 sigma), and there are no signs indicating the presence of special causes.
In such a situation, we observe natural variability of data from month to month, due to random (general) reasons. The employees of the unit worked in April, just like in previous months, and in each month they did their best.
A little theory
When a process exhibits a reasonable degree of statistical control, the process's behavior is predictable and it is in its best state. Such a process (and the people in it) does the best it can. Moreover, knowledge of the past behavior of such a process can be used to predict its future behavior. In all stable processes, random fluctuations in observed values occur within control limits, with these values distributed according to the rule of thumb shown in Fig. 4.
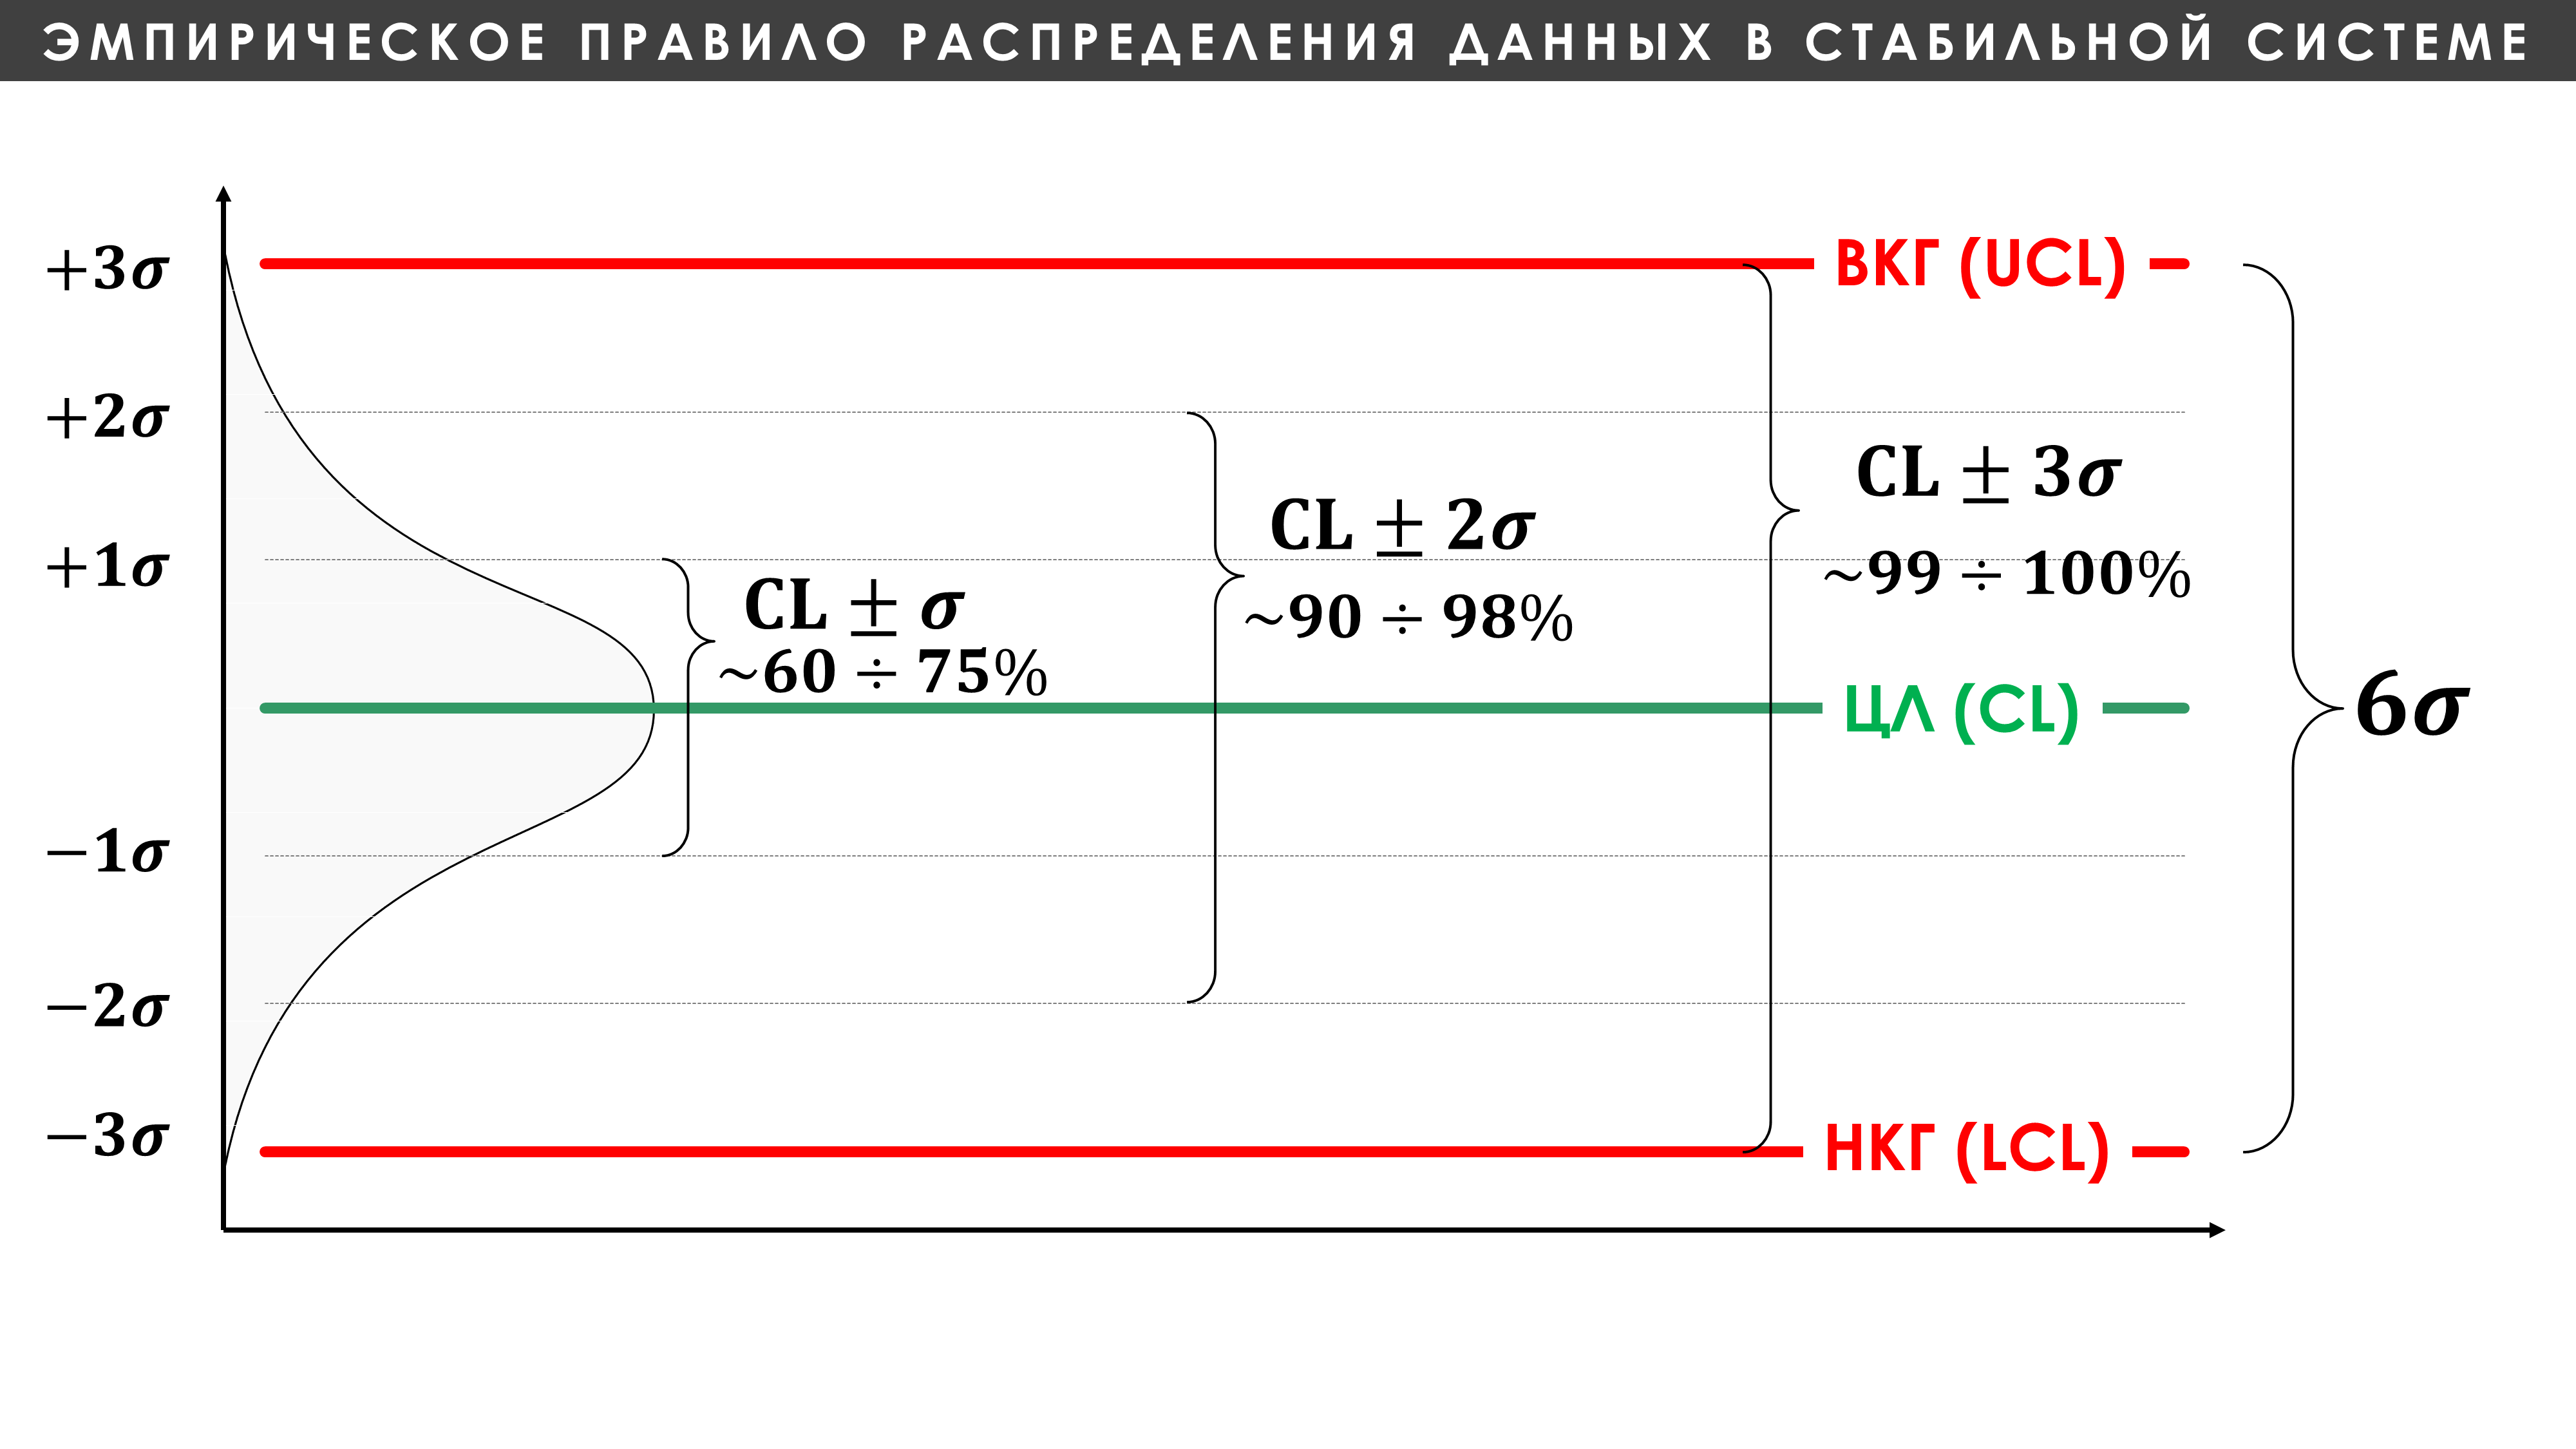
Figure 3. Rule of thumb for data distribution in a stable system. Shewhart control chart. LCG - lower control limit of the process, ВКГ - upper control limit of the process. For more details, see the article: Nature of Variability .
If you think otherwise, assuming that department employees performed worse in previous months than in April, then how can you confirm this? Even a child can compare numbers. I hope you don’t think that comparing numbers is the job of a manager?!
"Any two numbers that are not the same are considered different. Unfortunately, this is true when it comes to arithmetic, but it is not true when it comes to interpreting data. In this world, two different numbers may well represent the same thing."
If the company’s management has the desire and ability to pay a bonus, in the case under consideration it is better to use the distribution of its amount as a bonus to the wage fund of the current and future reporting periods for all employees of the company, for example, with the distribution of such a bonus fund in proportion to the current salaries of all employees, and not only those “involved”. Even the work of a cleaner, helping to create a clean and cozy atmosphere, has an impact on the overall results of the company.
Otherwise, you will be rewarding employees for random fluctuations for the better, which will periodically be replaced by random fluctuations for the worse from the center line (CL) under the influence of many, often implicit, random system reasons. And undeservedly leave others unattended.
Ultimately, this distribution of the bonus will be the only reasonable solution with remuneration in a stable system. Otherwise, you will reward employees for randomly obtained results in the reporting period. None of the department’s employees and even their manager will be able to understand and reasonably explain the true reason for the “high” output in April. This is equivalent to being rewarded for winning the lottery. And vice versa, depressing employees for unsatisfactory results of the reporting period within the system is the same as punishing them for losing the lottery.
How to determine a fair bonus for personal achievements?
For more information about this and what to do with those employees who work outside the system with better or worse results and how to evaluate real system improvements, see the open solution: Erroneous use of KPIs in the motivation system .