The concept of variability in process control
Source: CRISIS OF THE COAL MINING INDUSTRY AND MODERN MANAGEMENT THEORY Netsvetaev Alexander Glebovich, Rubanik Yuri Timofeevich, Mikhalchenko Vadim Vladimirovich / Kemerovo, Kuzbassvuzizdat, 1998, 92 pp., ISBN 5-202-00323-4, BBK U9(2Ros)3 05.651, N 38
Comment: Scientific Director of the AQT Center Sergey P. Grigoryev .
Free access to articles does not in any way diminish the value of the materials contained in them.
When developing control charts, W. Shewhart set the goal of improving quality by reducing variability in technological operations. W. Edwards Deming developed the idea of W. Shewhart, laying it as the basis of his management philosophy. He proceeded from the fact that the principles of management in social and business systems are subject to the same objective laws of variability as processes in technical systems. Dr. W. Edwards Deming convincingly showed that there can be no talk of effective management without understanding the basic concept of variability.
The concept of variability and process control
Technological process control problems include a large number of situations in which it is necessary to make decisions about changing process parameters in order to achieve the required output value. In particular, we can talk about adjusting equipment, changing the speed of the process, regulating the level of inventory, etc.
An essential feature of a situation of this type is the presence of a certain target value, while the person managing the process can take actions that worsen the performance indicators of the process if the nature of the observed variations is not taken into account.
Let's consider this using the example of gas flow control at an enterprise producing methane of biogenic origin. [Winlow A. System Thinking. British Deming Association 8th Annual Conference Proceedings, 1995]. The process technology was as follows. Urban waste was placed in the mined-out quarry space, which was then covered with a layer of soil. Under the influence of anaerobic bacteria, the process of waste decomposition began, which was accompanied by the release of methane in quantities sufficient for its use as an additional source of energy in the production of bricks. The amount of methane entering the production process was regulated by the operator by opening the valve on the gas pipeline at moments when its pressure dropped below a certain required value. The control chart for the volume of gas produced showed that the process is stable, but is characterized by an excessively large scatter (Fig. 1).
Figure 1. Control chart for gas volume (adapted from Winlow A. System Thinking. British Deming Association 8th Annual Conference Proceedings, 1995.).
It has been suggested that a possible cause of excess variability is interference with the functioning of a stable system. Regulating the flow of gas by opening the damper at moments when its pressure dropped below the average value could introduce additional variability into the process. Intervention in the process was stopped, and it quickly returned to a new state, characterized not only by a significantly smaller scatter, but also by a higher average gas flow.
Further research revealed the nature of the system’s “swinging” mechanism. As a result of interference in the gas generation process, the activity of anaerobic bacteria was suppressed due to the intense air flow at the moments of additional opening of the gas pipeline damper.
The considered example illustrates a typical error in engineering practice associated with interfering with the operation of a stable system. Trying to improve the situation, the person managing the process reacts to individual deviations, while losing sight of the fact that these deviations may be a manifestation of systemic properties. As a result of such actions, the variability at the system output increases - the system “swings”, its functioning deteriorates, additional losses arise (In this case, rules 2 and 3 of the experiment are implemented with funnel and target . – Note Sergey P. Grigoryev).
A comment
In response to the proposal of people with an inquisitive mind, who were not too lazy to build a control chart, having previously digitized the graph from Figure 3.4., I am making my comments on the article.
Control chart, see Fig. 2. has already revealed changes in the process (instability under the influence of special reasons), but the authors of the article did not pay attention to this and reported a stable state of the process, mentioning only “excessively large scatter.” What does “excessively large scatter” mean for this process, compared to what is excessive, is not clear operational definition "excessive".
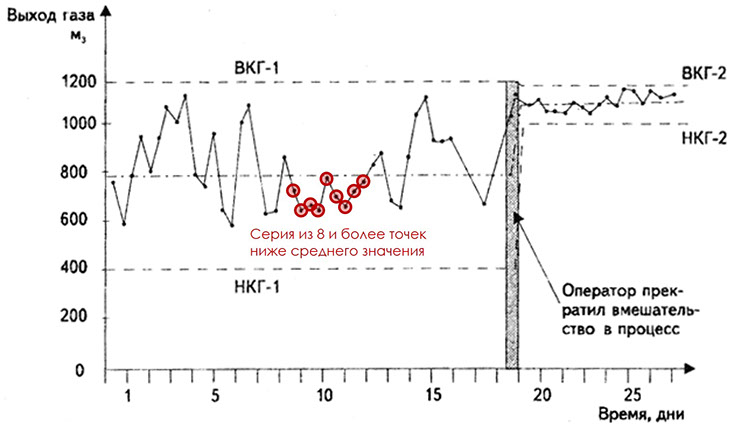
Figure 2. Control chart for gas volume according to Figure 1. with highlighted points indicating statistically significant (noteworthy) changes in the system under the influence of special reasons. The mR chart of moving ranges confirmed the system’s exit from a stable state at the same points.
The authors of the analysis had to understand the special reasons that led to the disruption of the stable state of the process at points 20-28 (circled in red). Even taking into account that with a delay, the search for special causes is always complicated. And a significant reduction in variability visible to the naked eye in this section of data should have interested the authors in studying the conditions of the process, with signs of a better state of the process, in terms of variability. What happened there, what actions were taken or, conversely, not taken in relation to the process, what happened to the inputs to it?
Perhaps such a study would reveal an association with reduced operator intervention in adjusting the opening of the damper. The authors would not have to guess the reasons for the “excessively” high variability and conduct dangerous experiments on the technological process.
The constant intervention of the operator (or automation) in the control of a stable process actually increases the spread of data and requires significantly higher costs for regulation (frequency of adjustments, understandable algorithms of actions, unnecessary cognitive activity of the operator) than simple observation using Shewhart control charts of a process in statistically controlled state using Shewhart control charts.
It is important to understand that the goal of continuous process improvement implies, first of all, if the process is in a statistically unstable (unpredictable) state, identifying special causes affecting it, eliminating them, and if it is impossible to eliminate them, minimizing their influence on the process to bring it into a predictable state. state. Or, conversely, if under the influence of special reasons the process is in a better state from the point of view of its goals, take these reasons into account and make them systemic (general) reasons. Only after the process has been brought to a stable state can solutions be sought and measures taken to reduce the variability of the predictable process, which will give the right to take into account the data obtained as a result of such measures. And not because variability seemed “excessive” to someone, but because reducing it always improves the process itself. Moreover, the gas release process considered in the article has already demonstrated in the past such better states in terms of the size of the data spread (points 20-28, circled in red), although with an average gas release significantly lower than that achieved by the authors of the article at the end of the experiment.
By the way, shifting the average of a stable process towards the target value is usually much easier than reducing its variability. See the open solution explaining this statement: Correct and incorrect ways to use tolerance fields. Should products be sorted according to tolerance margins for defective and non-defective, or should we try to customize the process?
Why did we post this article if the length of the notes to it is commensurate with the article itself?
The authors of the article have done important work in communicating the effectiveness of using new knowledge about the nature of variability in improving quality and improving processes and systems.