Simulator for sequential automatic construction of Shewhart control chart using historical data
![Button [Simulator of sequential construction of Shewhart control chart using historical data]](https://advanced-quality-tools.ru/images/buttons/simulator.jpg)
You have the opportunity to use the simulator to sequentially build an XmR control chart of individual values, a histogram and a scatter plot from historical data, from the first 3 (three) points, as if the control chart was maintained by those who consistently enter data, for example, machine operators in workshop. Analysts will be able to discover new ideas for process improvement using this software feature. When adding each new point, a complete recalculation of the process control limits and the central line is performed.
The data source for the simulator function is the raw data used to construct the XmR control charts of individual values.
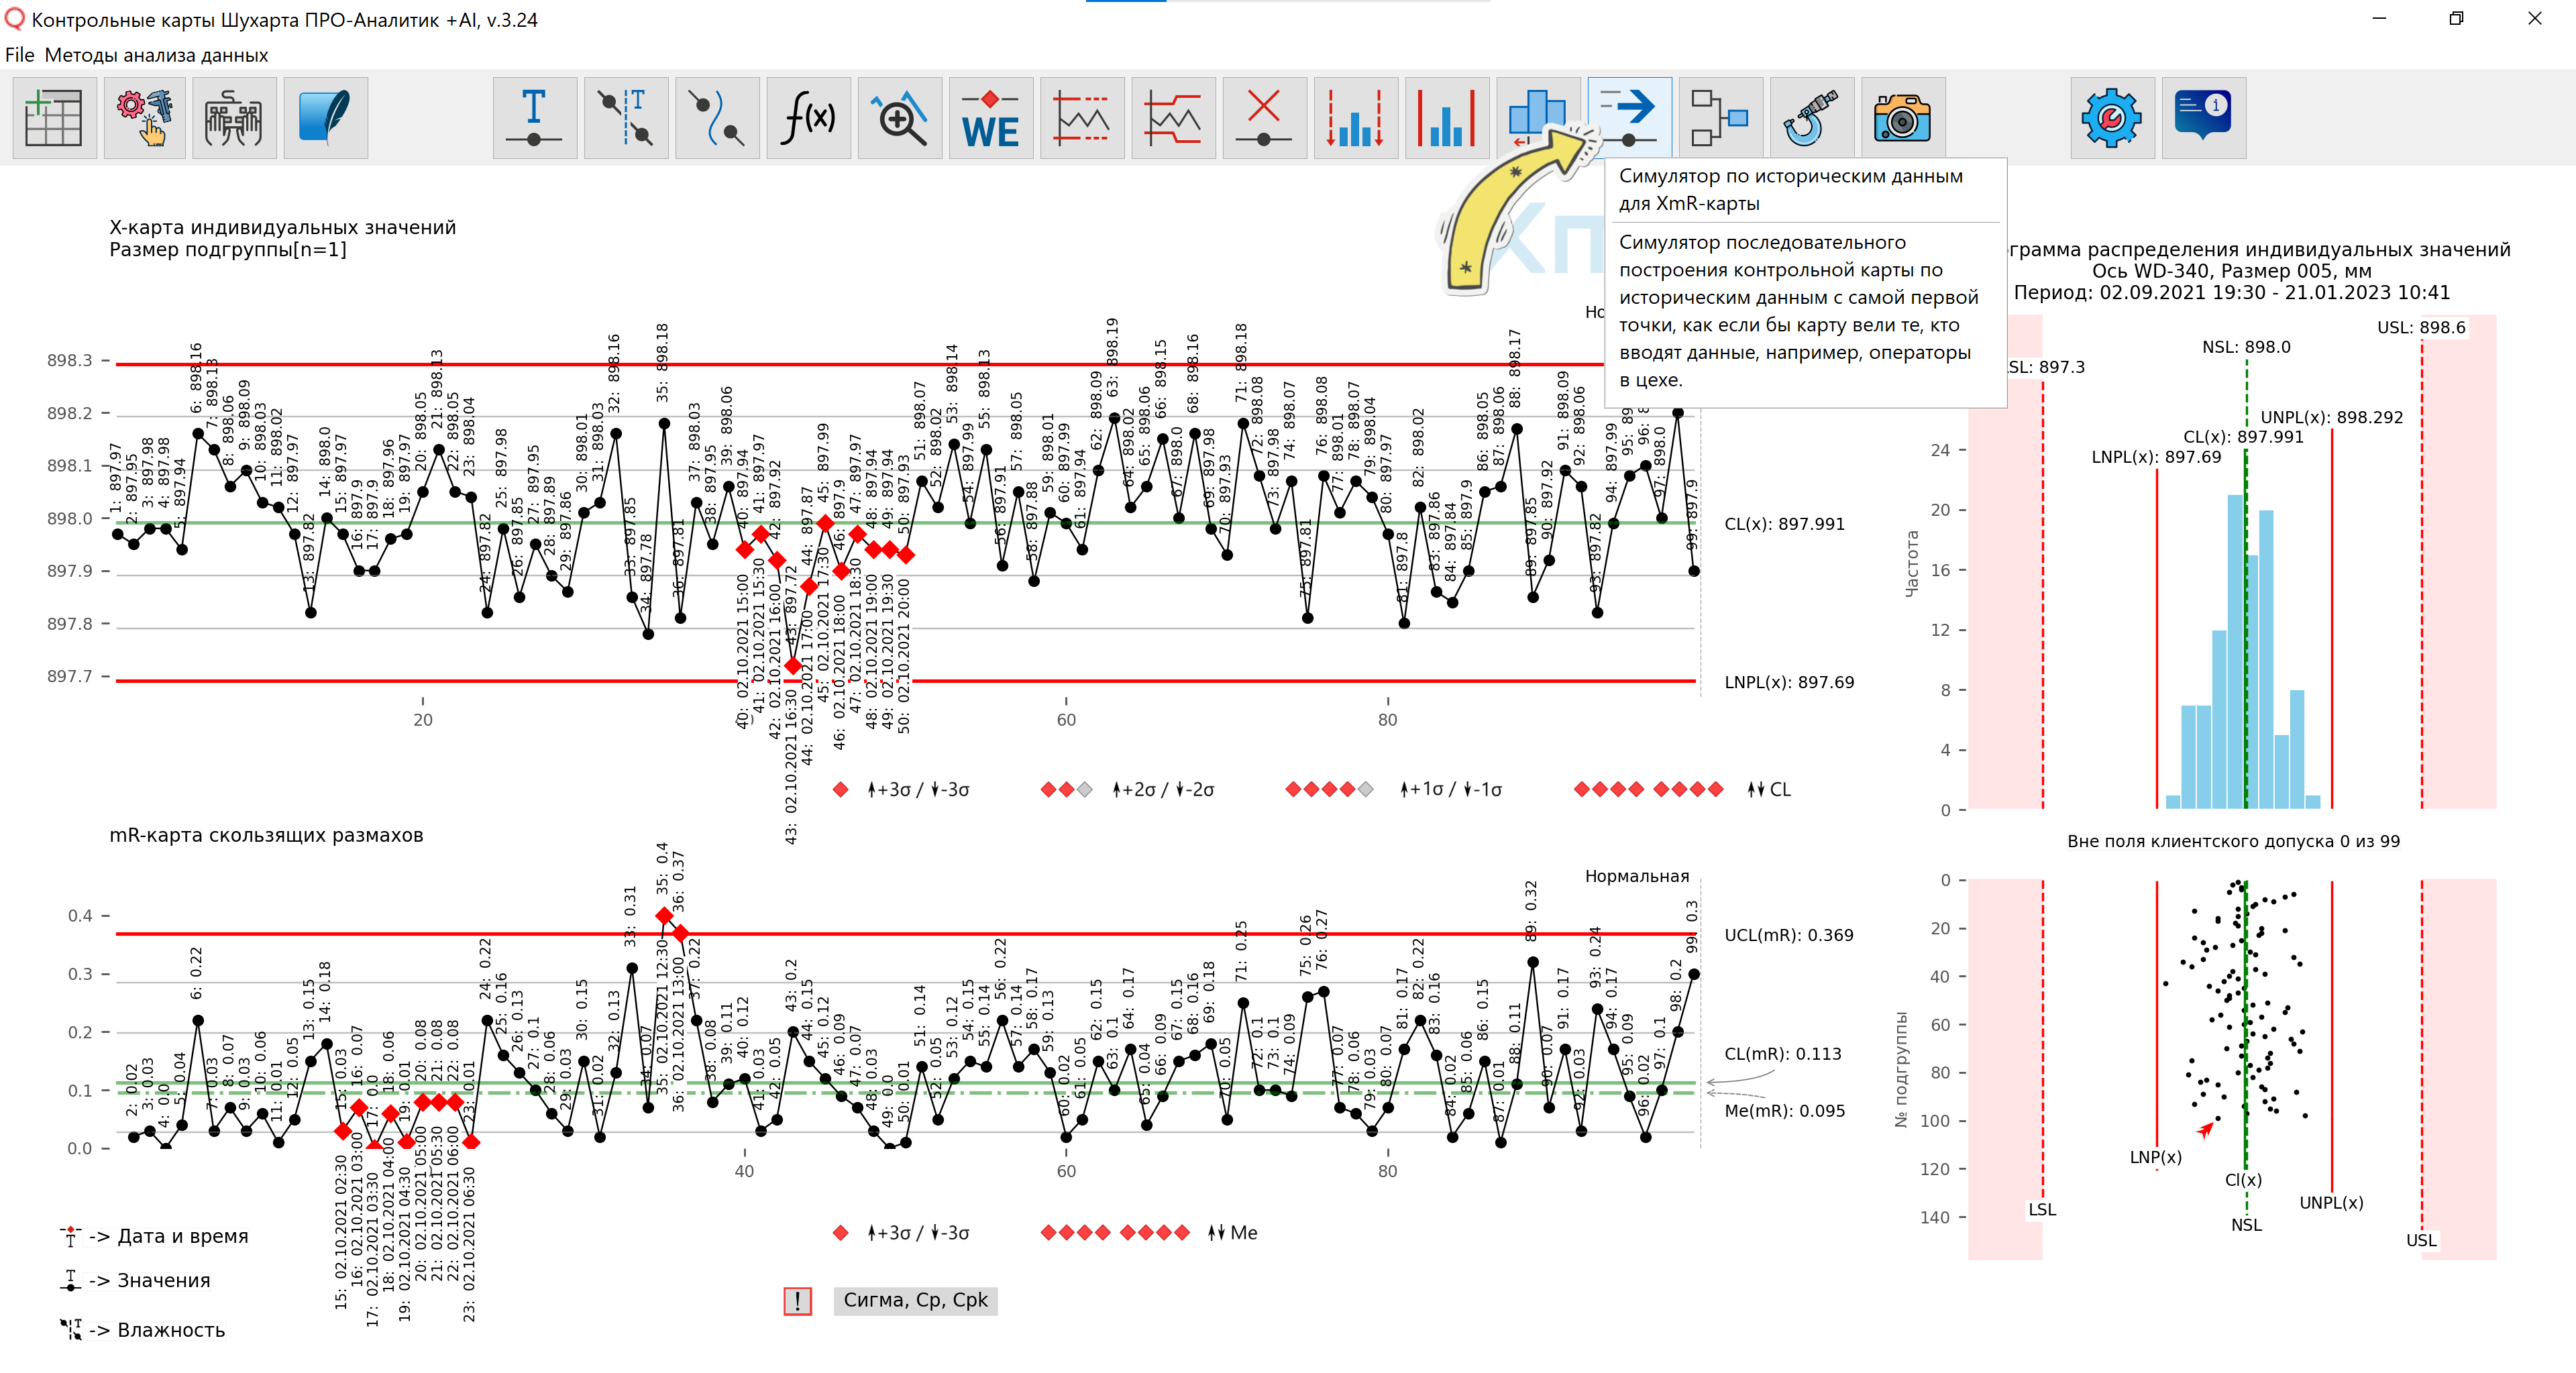
Figure 1. Simulator for sequential construction of a Shewhart control chart using historical data. Main menu. A tooltip appears when you hover your mouse over the button to go to the simulator control panel.
Legend: UNPL(x) - Upper Natural Process Limit / Upper natural process limit; CL(x) - Center Line / Central line (process average); LNPL(x) - Lower Natural Process Limit / Lower natural process limit; LSL(x) - Lower Specification Limit; NSL(x) - Nominal Specification Line; USL(x) - Upper Specification Limit; UCL(mR) - Upper Control Limit(mR) / Upper control limit of moving ranges CL(mR) - Center Line(mR) / Central line of moving ranges (average mR); Me(mR) - Median Line(mR) / Line of the median of moving ranges
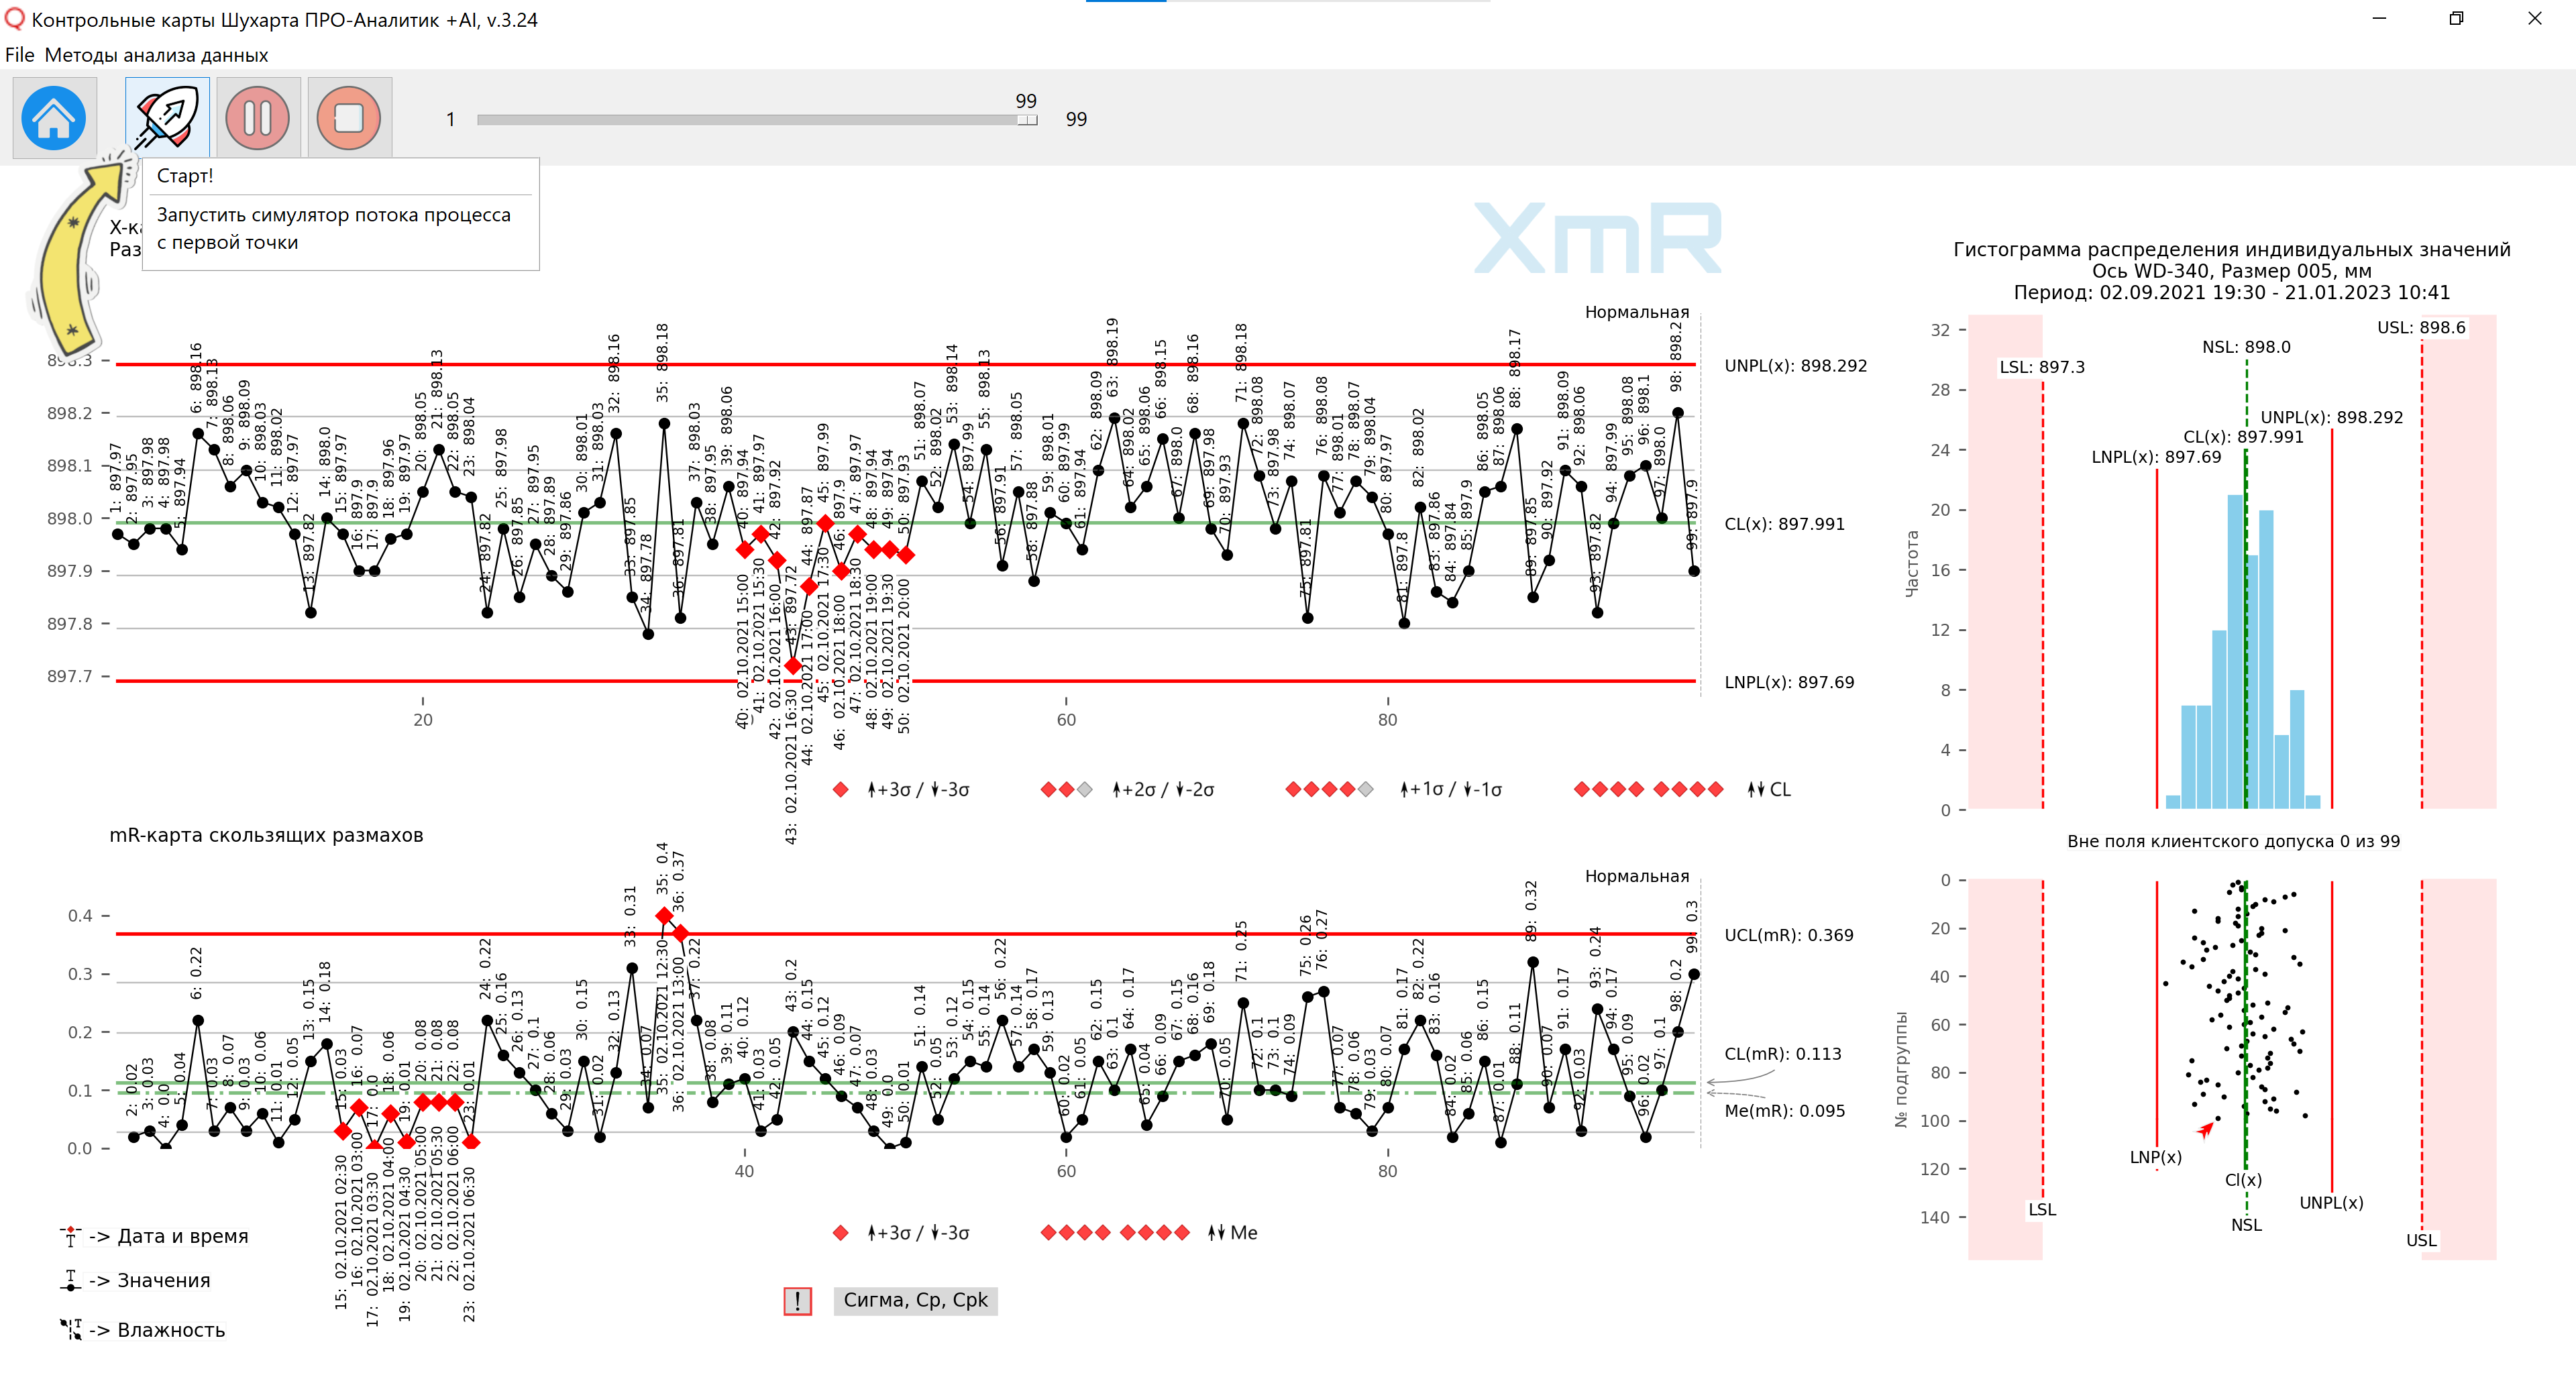
Figure 2. Simulator control panel. A tooltip appears when you hover the mouse over the [Start!] button. The [Pause] and [Stop!] buttons are inactive until the simulator starts.
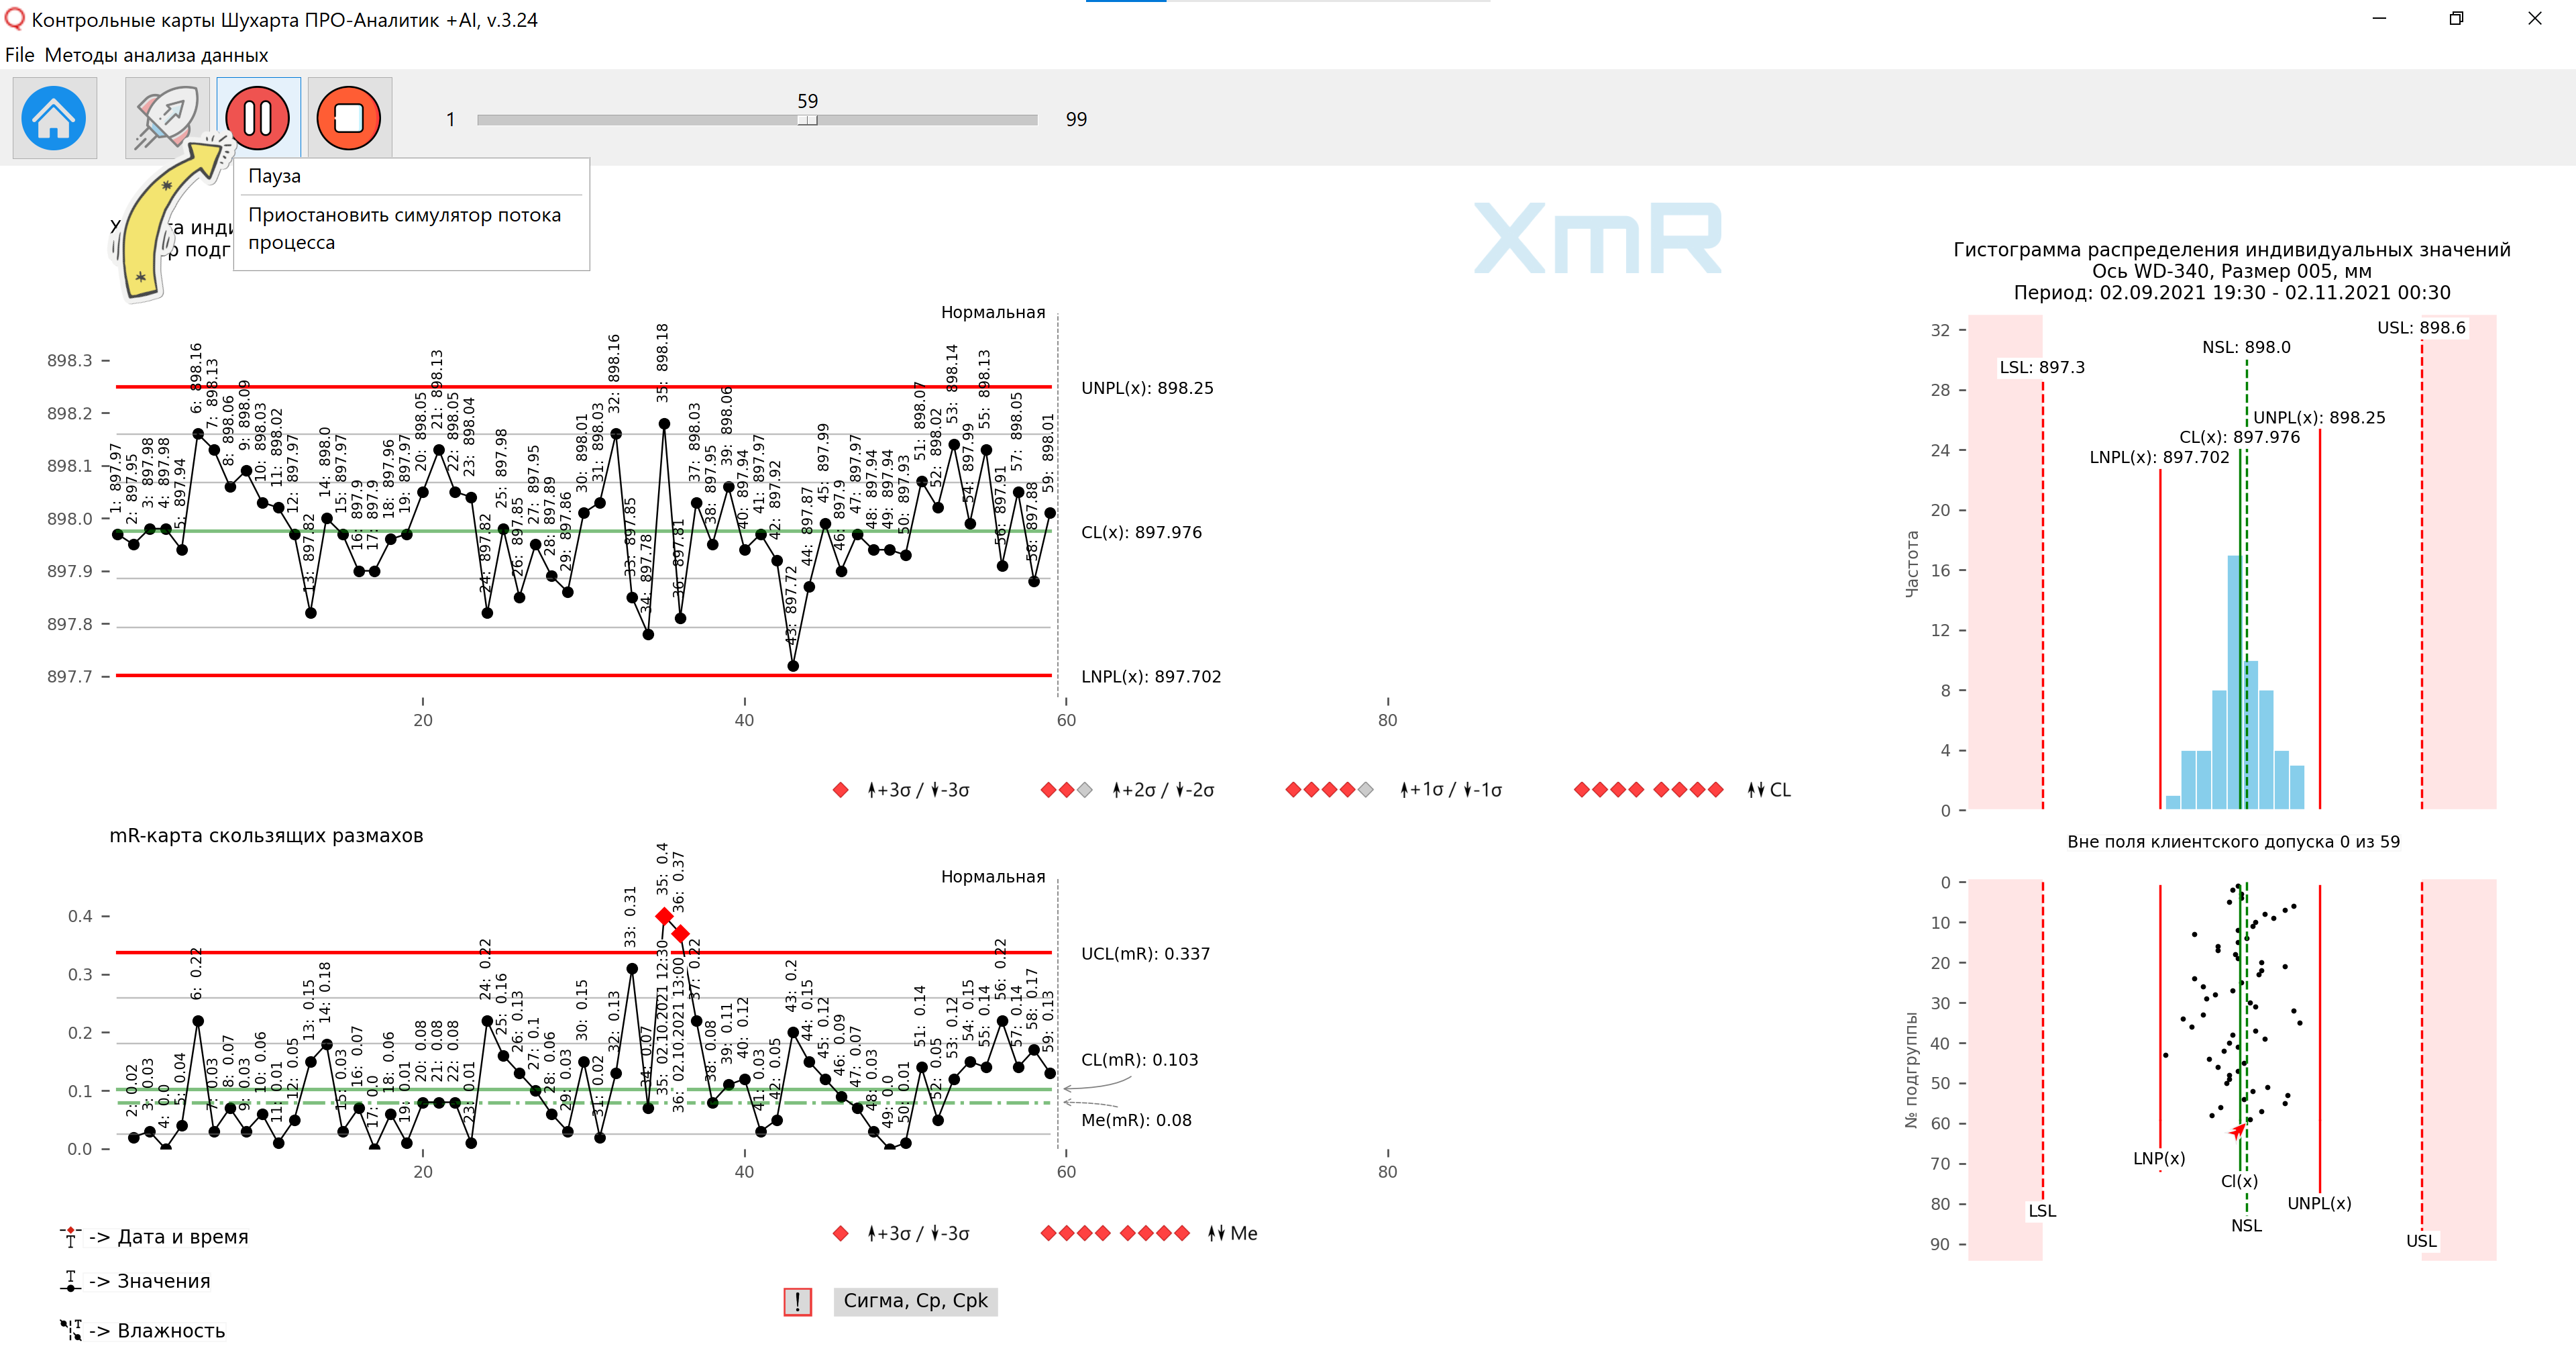
Figure 3. Simulator control panel. After starting the simulator, the [Start!] button is deactivated, and the [Pause] and [Stop!] buttons are activated.

Figure 4. Simulator control panel. After clicking the [Pause] button (Figure 3), the simulator pauses, and the [Pause] button changes to the [Continue, Play] button. A tooltip appears when you hover your mouse over the [Play] button.
After clicking on the [Pause] button (Figure 3), the simulator is paused, and the [Pause] button changes to the [Continue, Play] button, clicking on which will continue the simulation from the point where the simulator was paused.
By pausing the simulator with the [Pause] button, the analyst can begin working with the control chart section built in the simulator, using the program functions:
- hide/hide signatures, vertical lines of series separators, application of a graph line break with searching through all possible options from other data columns;
- delete/apply tolerance limits, assign a production narrowed tolerance, set a new tolerance or a new process goal ;
- apply/cancel scaling ,
After which you can continue or stop the simulation completely.

Figure 5. Simulator control panel. After pressing the [Stop!] button, the simulator goes into the readiness mode for a new launch, and the [Pause] and [Stop!] buttons are deactivated, going to the initial state (Figure 2). A tooltip appears when you hover the mouse over the [Stop!] button.
You can use process simulation while simultaneously using other software functions.
For example, in the demo video [1] below, the simulator function for the XmR-chart is used in conjunction with the functions of signatures of all and “red” points selected in accordance with Western Electric zonal criteria; displaying vertical lines to separate series of points on the control chart according to the zones of action of sources of variation.
Video 1. Simulator of sequential construction of a Shewhart control chart using historical data. Software "Shewhart control charts PRO-Analyst +AI (for Windows, Mac, Linux)".
Starting to build a control XmR-chart of individual values and moving ranges from three points, and an XbarR-chart of averages and ranges of subgroups from three subgroups, you can get a hint to answer the question that practitioners ask more often than others: “What is the minimum number of points needed to build a control cards?".
Our answer is that it is advisable to have at least 7-10 points to plot on the control chart. But when you are limited in data, you can start building control charts with what you have. This approach to process research is determined by the very methodology of constructing control charts (see paragraph above). The construction of control charts based on historical data of real processes, implemented in the simulator function, will allow you to track how the control limits and the position of the central line of your processes change depending on the number of points used to build the control chart.
Also see definition reasonable degree of statistical controllability process.
Similar to rewatching surveillance video
Consistently adding new points from a series of historical data to the control chart, like re-watching surveillance video, will clarify your understanding of the process being analyzed and demonstrate the incredible effectiveness (robustness) of Shewhart control charts for timely signaling of special causes of observed variations in control charts. at the shop level by workers and supervisors.
“The guiding principle of control charting should be to reveal the unknowns of a process rather than to demonstrate what is already understood.”