Experiments, big data or Shewhart control charts?
Article by Donald Wheeler: "Different Approaches to Process Improvement. Does Your Approach Do What You Want?"
DONALD J. WHEELER: "Different Approaches to Process Improvement. Does your approach do what you need?"
Translation: Scientific Director of the AQT Center
Sergey P. Grigoryev
.
Free access to articles does not in any way diminish the value of the materials contained in them.
Today, various approaches to process improvement are proposed. Evaluating how each approach works is critical to choosing which one will be effective. Here we look at the production problem and how different improvement approaches solve this problem.
Production problem
For the purposes of the following discussion, a causal relationship will exist when changes in the meaning of the cause result in changes in the meaning of the product characteristic. Here we define a cause effect as the variation created in the flow of a product when the cause changes in its natural range of values. When the cause is limited and cannot change, it will no longer create any change in the value stream of the product.
Any specific characteristic of a manufactured product will be the result of dozens, if not hundreds of cause-and-effect relationships. These causes can be divided into two groups: those causes that we know well enough to name, and those causes that act without our knowledge and therefore remain unknown to us. Before we begin production, the consequences of all these causes may be unknown, resulting in a picture similar to Figure 1.
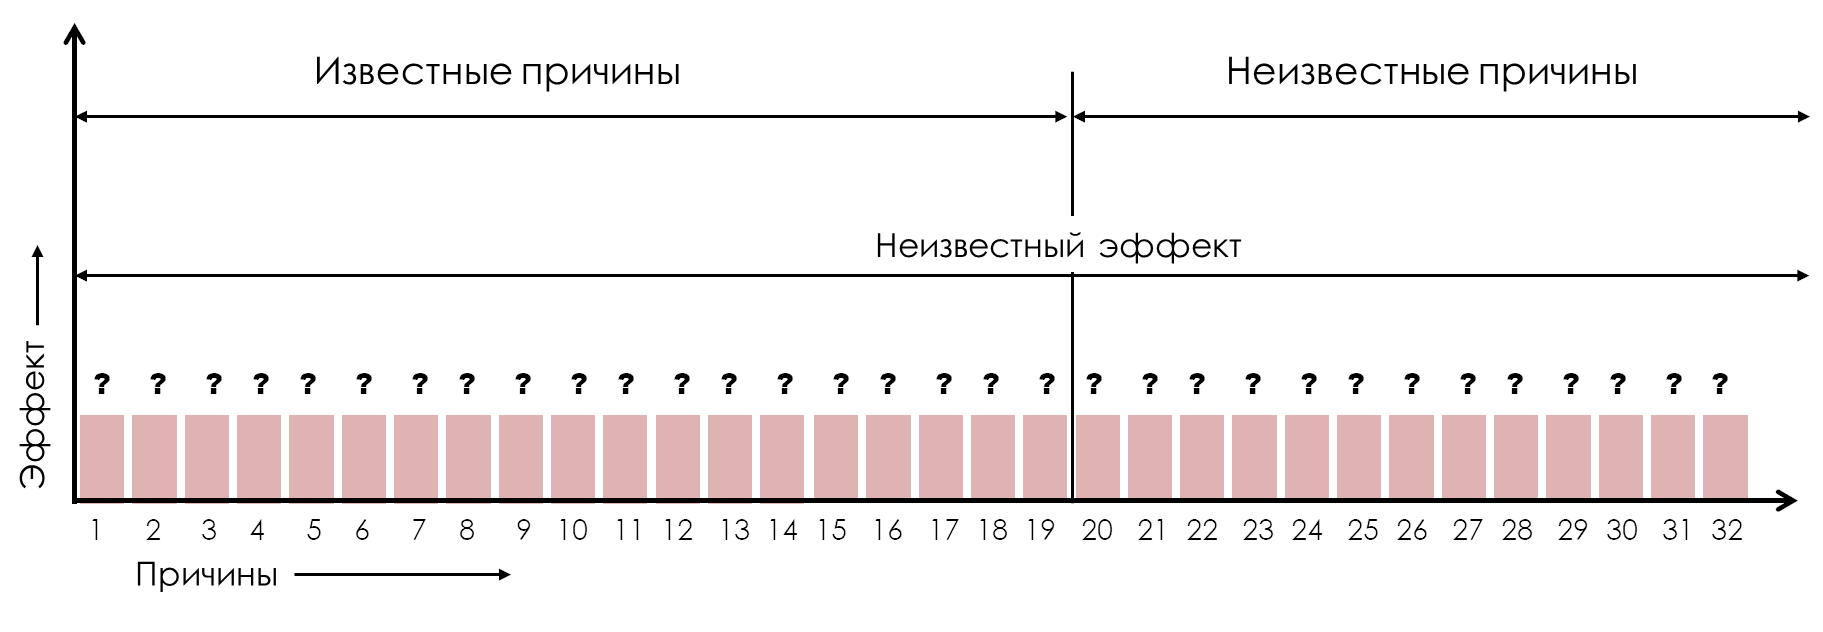
Figure 1: Two categories of cause-and-effect relationships
Typically, R&D studies a subset of known causes to determine their consequences. These reasons studied will be those which are considered to have a pronounced influence on the characteristics of the product. Once these effects are known, this set of learned causes can be organized into a Pareto diagram (Groups I, II) as shown in Figure 2.
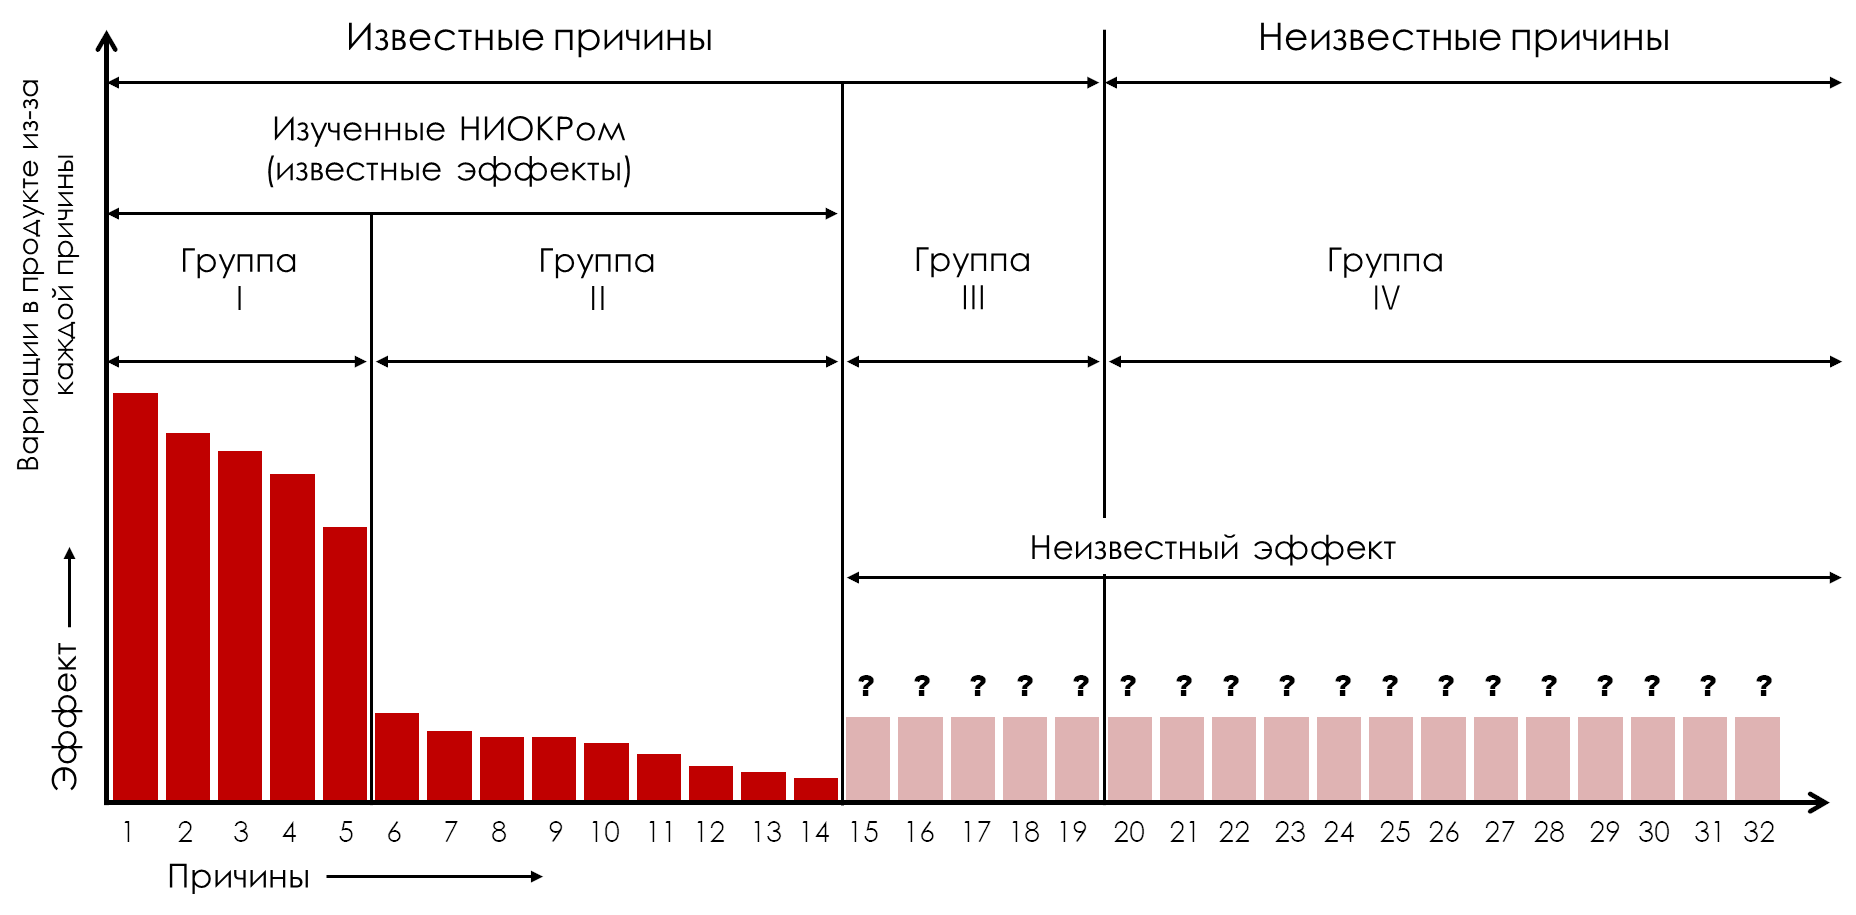
Figure 2: Pareto diagram of known effects for the studied causes (Groups I, II)
Let us designate the reasons from the first to the fifth as the reasons of the first group (Figure 2, Group I). These causes have dominant effects and are the causes we want to control during production. By holding these five causes constant, we will effectively remove their influence from the product flow. At the same time, the fixed values chosen for each of these five causes will collectively determine the average value of the process.
Reasons from 6 to 14 are reasons of the second group (Figure 2, Group II). These causes have such minor consequences that we will not attempt to control them in production. (These are usually the reasons why the costs of control exceed the benefits of control.)
Among the 14 causes R&D examined, if no attempt was made to control these causes, the effects of five causes in group one would account for 85 percent of the variation in product flow, while the remaining nine causes in group two would contribute 15 percent of the variation. Thus, by controlling the first group of causes, we eliminate 85 percent of the variation in product flow caused by the studied causes.
The causes of the third group (Figure 2, Group III) are those known causes that have not been studied by R&D. Typically, these are causes whose consequences were considered minimal and therefore not worthy of study. However, as shown in Figure 2, these causes will actually have unknown consequences.
For convenience, we denote the totality of all unknown cause-and-effect relationships that affect our process without our knowledge as the causes of the fourth group (Group IV).
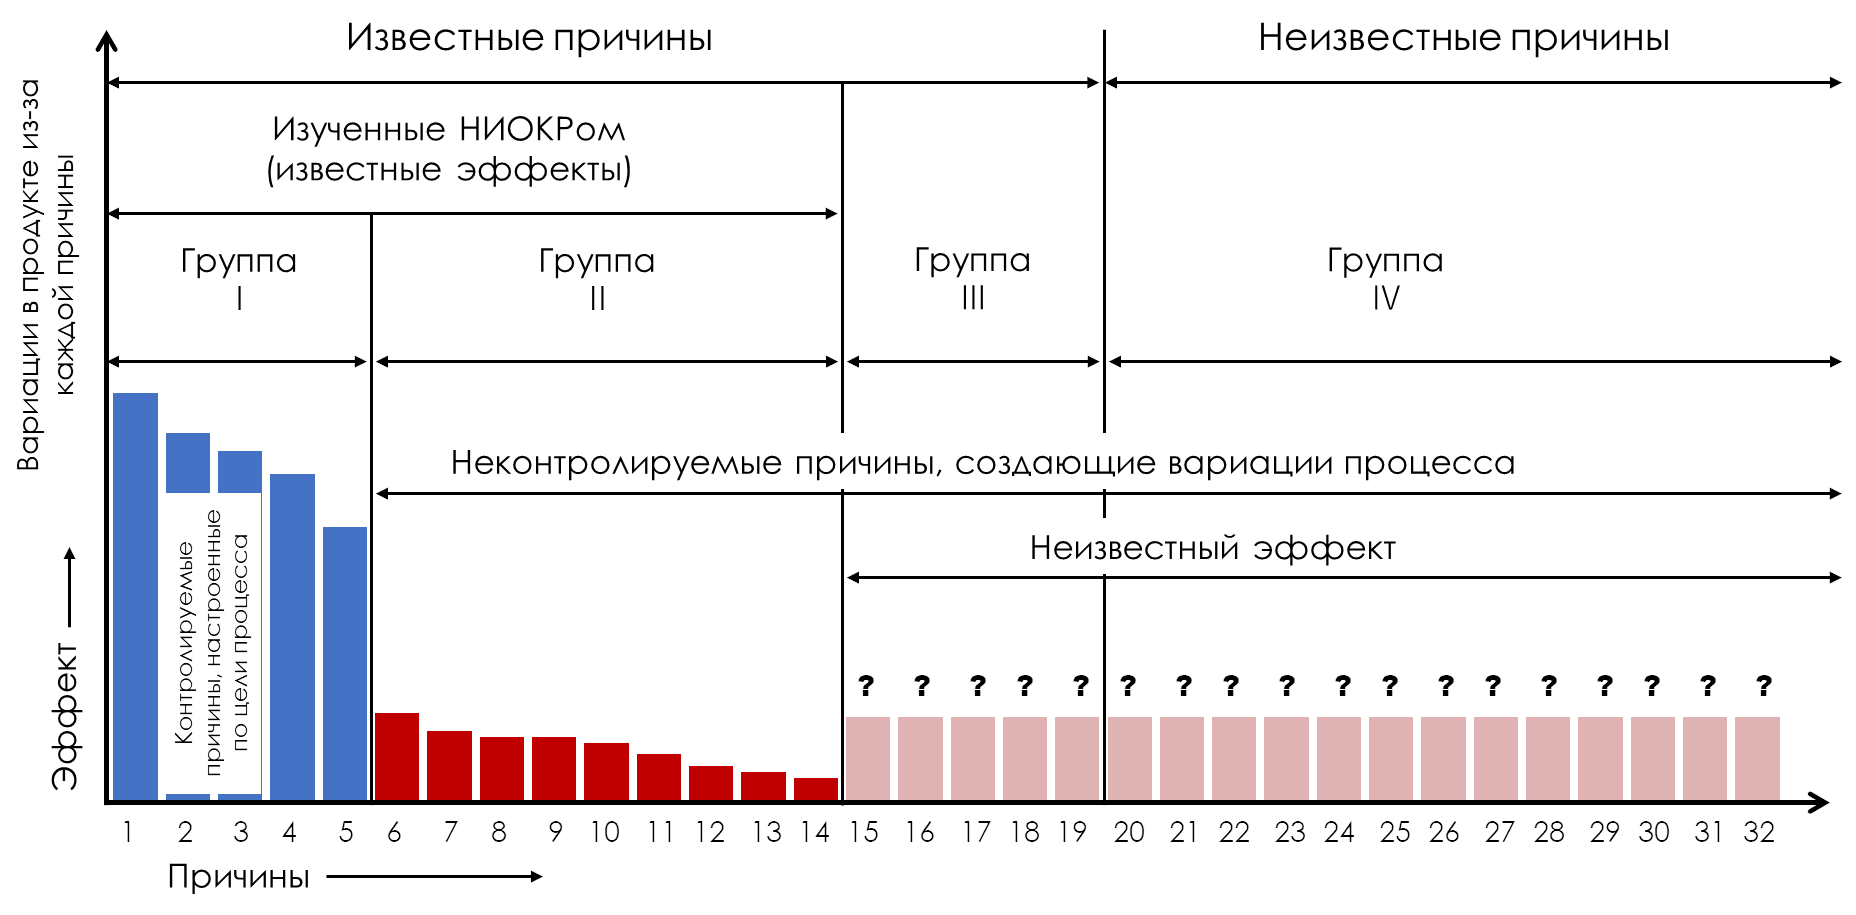
Figure 3: Process variation occurs due to all uncontrollable causes.
Unfortunately, variations in the flow of products produced are not limited to the causes of the second group (Group II). Causes in the third (Group III) and fourth (Group IV) groups also contribute to this variation. Since the causes in these three groups (Groups II, III, IV) are different, each will contribute to variation in product characteristics, and all these sources of variation will add up to variation in product flow. This is why the variations observed in production usually exceed the variations predicted by R&D.
Finally, there is no guarantee that all unknown effects of Groups III and IV causes will be insignificant. Additionally, these effects may change over time. These changes may occur due to wear and tear, changes in personnel, developments in work methods and changes in the supply of materials. When these changes occur, they can make process improvement even more difficult.
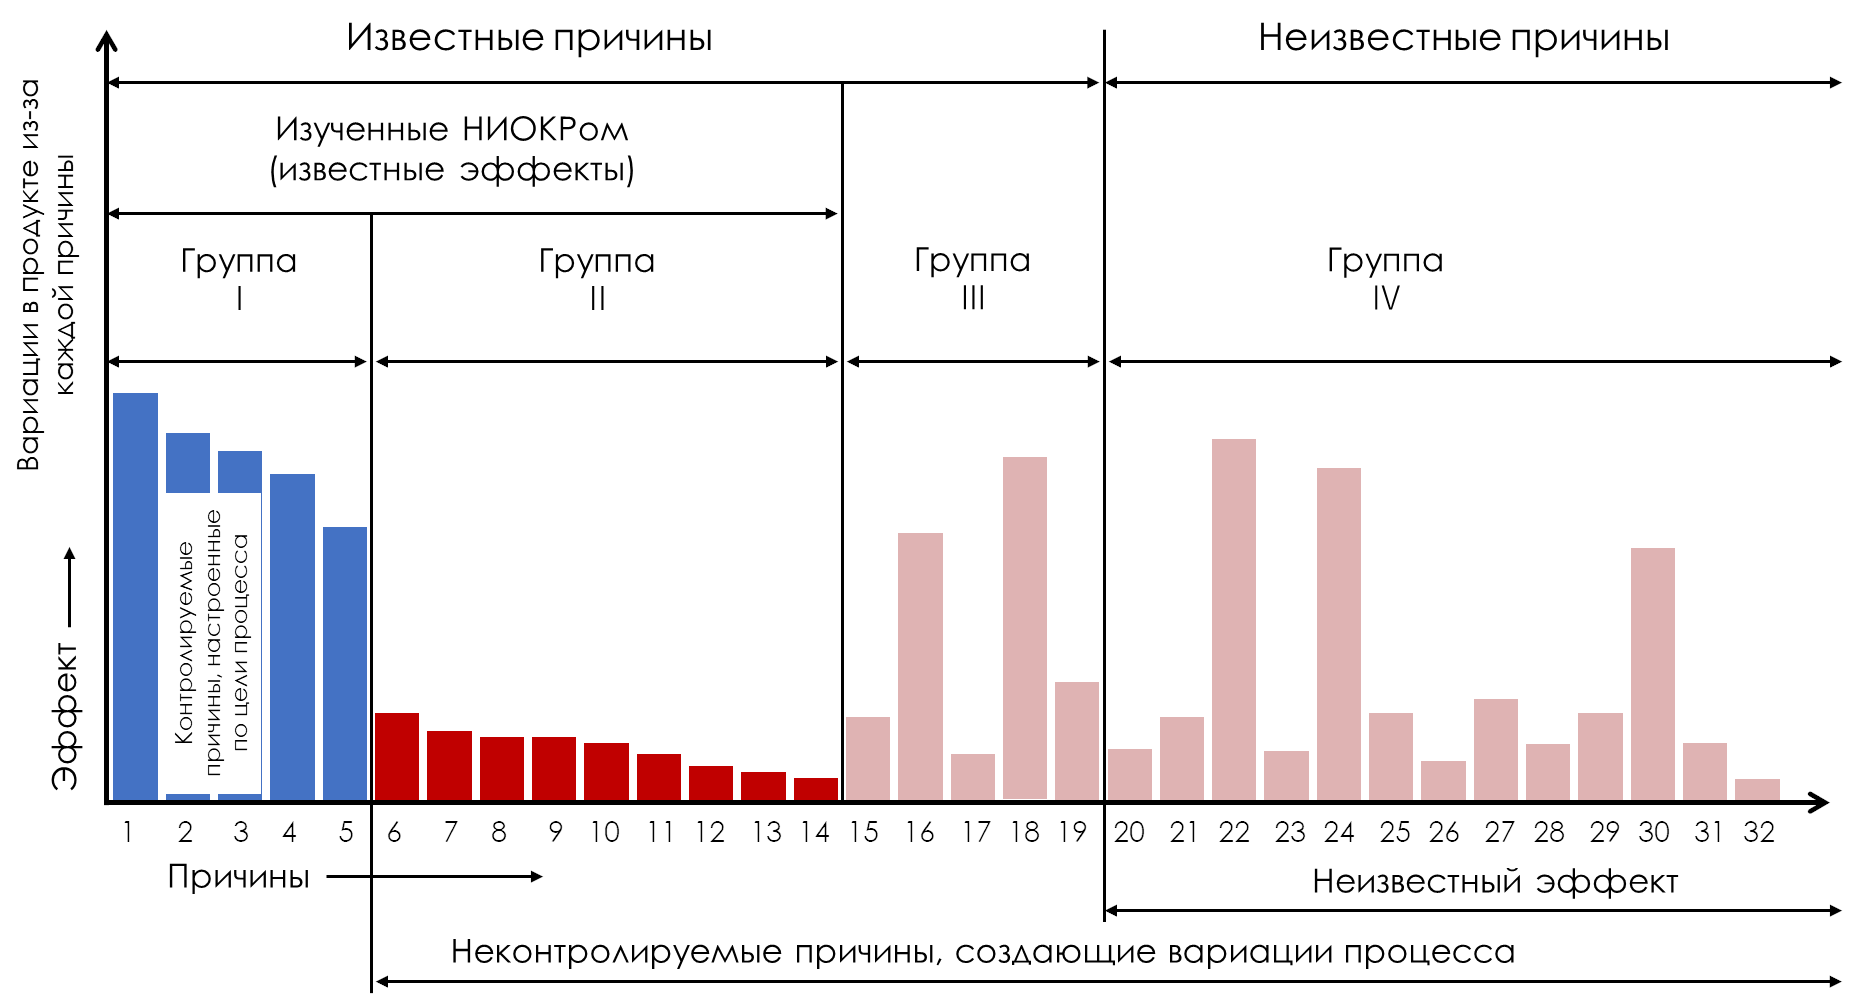
Figure 4: Some uncontrollable causes may have dominant effects.
Figures 3 and 4 thus provide a framework against which we can evaluate different improvement approaches. They characterize what we know and what we don't know so that we can see how a particular approach relates to each element of the process improvement problem.
From Figure 3 we see that the problems of tuning a process to its target (nominal) will be associated with the choice of levels for causes in the first group (Group I). Problems of reducing variation in product flow will be associated with causes from the other three groups (Groups II, III, IV).
So how can we reduce process variability? Essentially, the only way to reduce variation is to remove the effect from the product stream while holding its cause at some fixed level. In other words, we eliminate variation by moving a cause from the second, third, or fourth group (Groups II, III, IV) to the first group (Group I).
However, before moving a cause to the first group (Group I) becomes cost-effective, the benefits must exceed the costs. This means that the cause must have a dominant effect before it is economically feasible to attempt to control it.
Thus, the task of reducing process variability is to find causes with predominant effects in the second, third or fourth groups (Groups II, III, IV), and then transfer these causes to the first group (Group I).
Experimental approaches
Several approaches to process improvement rely on a series of experiments. Experiments allow us to study individual causes to quantify their impact on a given product characteristic. These experimental approaches cover everything from simple single-cause experiments to designed multi-cause experiments. Regardless of complexity, experimental studies always require manipulation of process inputs. This limits experimental approaches to studying known causes from the first, second or third groups (Groups I, II, III).
Once the reasons from the first group (Group I) have been studied, you will have an optimization study. Here you will strive to find such a combination of values of the reasons of the first group that will lead to the optimal value for matching the studied product characteristic to the process goal (nominal).
When experimental studies are used with causes from groups two or three (Groups II, III), the goal is to identify any causes that may have a dominant effect. When such causes are identified, they can be moved to the first group to remove their variations from the product flow. Of course, experiments with Group 2 (Group II) causes will look for large effects where R&D originally found only small effects. And experiments investigating Group 3 (Group III) causes will look for large effects where large effects were not thought to exist. However, over time, due to wear and tear and other effects of entropy, causes that previously had little effect can become causes of large effect.
For this reason, experiments with causes from the second and third groups (Groups II, III) can sometimes be useful. In Figure 4, reasons 16 and 18 (Group III) were found to have dominant effects and were therefore moved from Group 3 to Group 1 (Figure 5). This reduced the Average Cost of Production and Use (ACP&U) for this process to 75 percent of what it was in Figure 4.
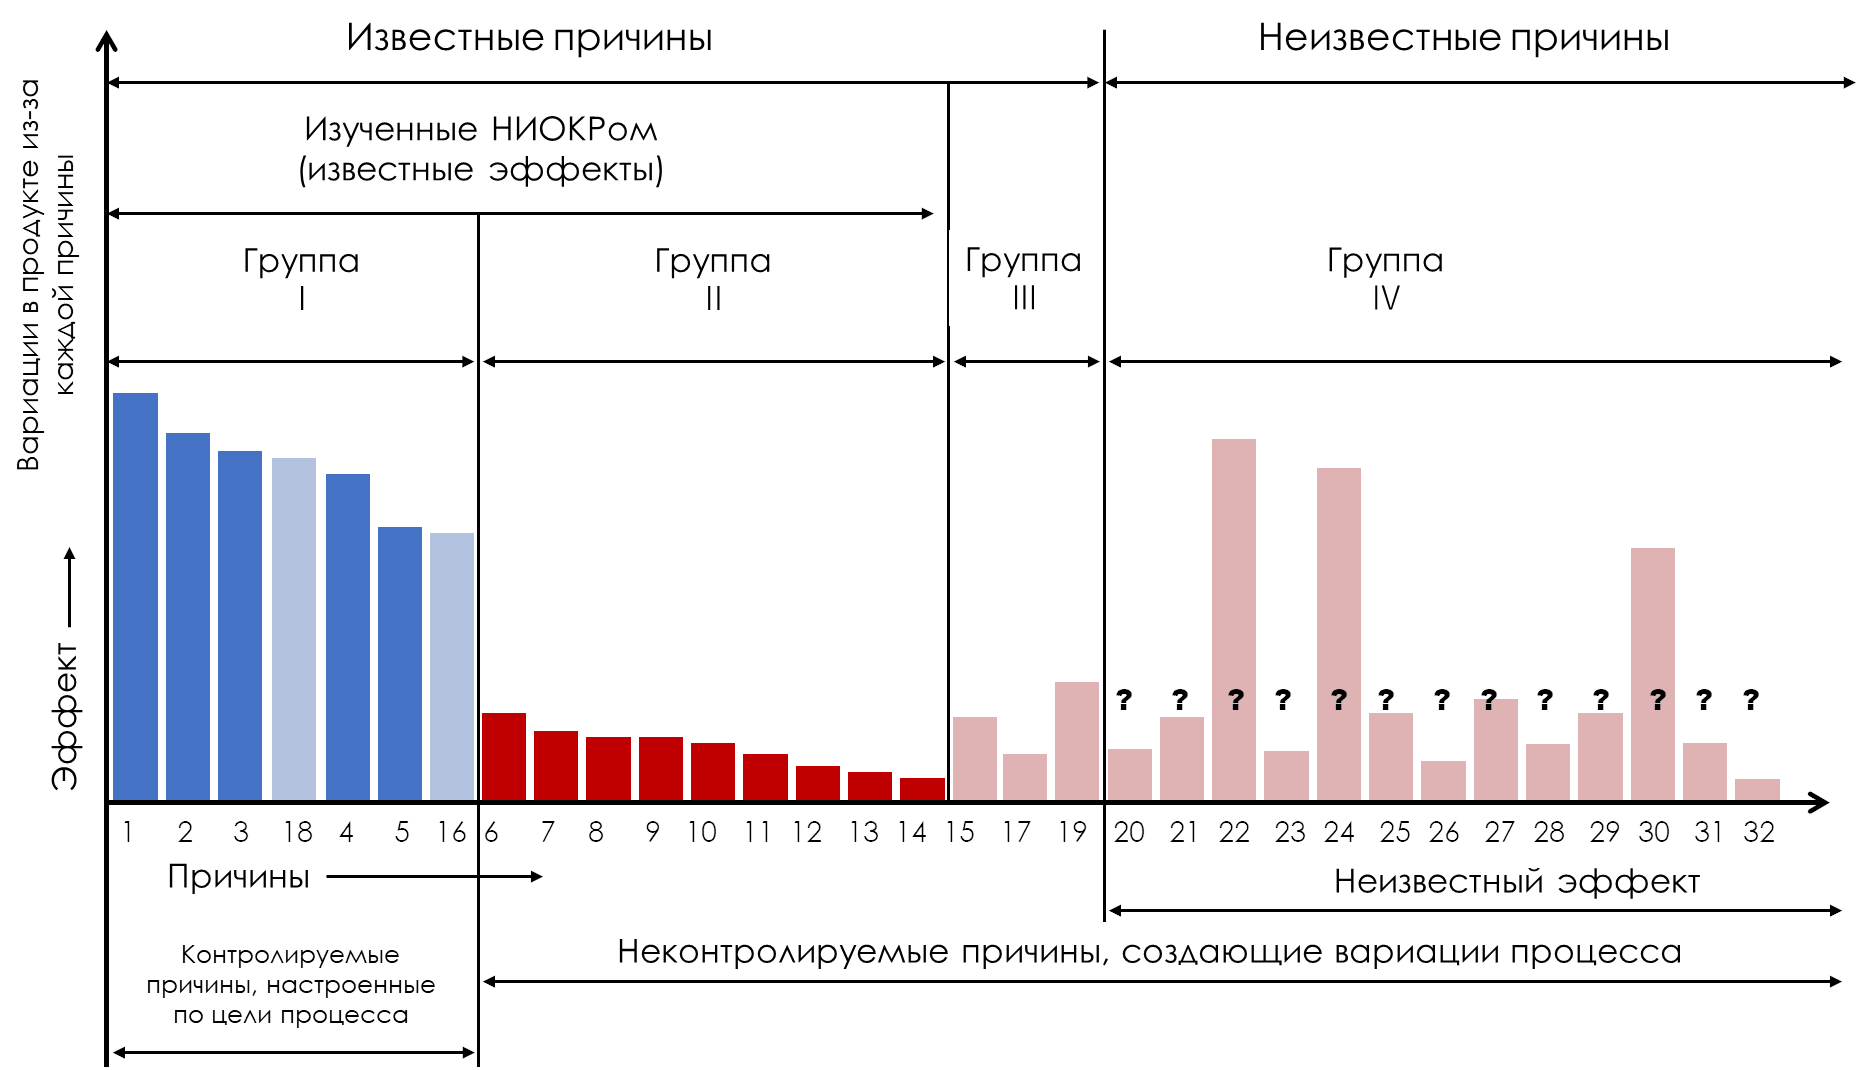
Figure 5: What experimental results can be achieved
But what about the causes in the fourth group (Group IV)? Although we cannot study unknown causes in an experiment, this does not mean that our experimental results are free from the influence of any unknown causes in the fourth group. If the dominant cause from the fourth group changes during the experiment, it can ruin the analysis and ruin the experiment. (Most statisticians can tell you stories about what happened when some extraneous variable from outside the study interfered with the experiment.)
Thus, although experimental studies are essential for process design and allow us to analyze the effects of different process inputs, they face certain limitations in process improvement tasks. Although experiments allow us to obtain specific answers to specific questions, their usefulness is limited when we do not know what questions to ask.
Observational approaches
Experimental research always begins with identifying a set of causes to study. Observational approaches do not do this. Rather, they seek to gain insight into a process using existing data. Because existing data will typically be obtained while the causes in group 1 (Group I) remain constant, observational approaches will tend to focus on uncontrollable causes.
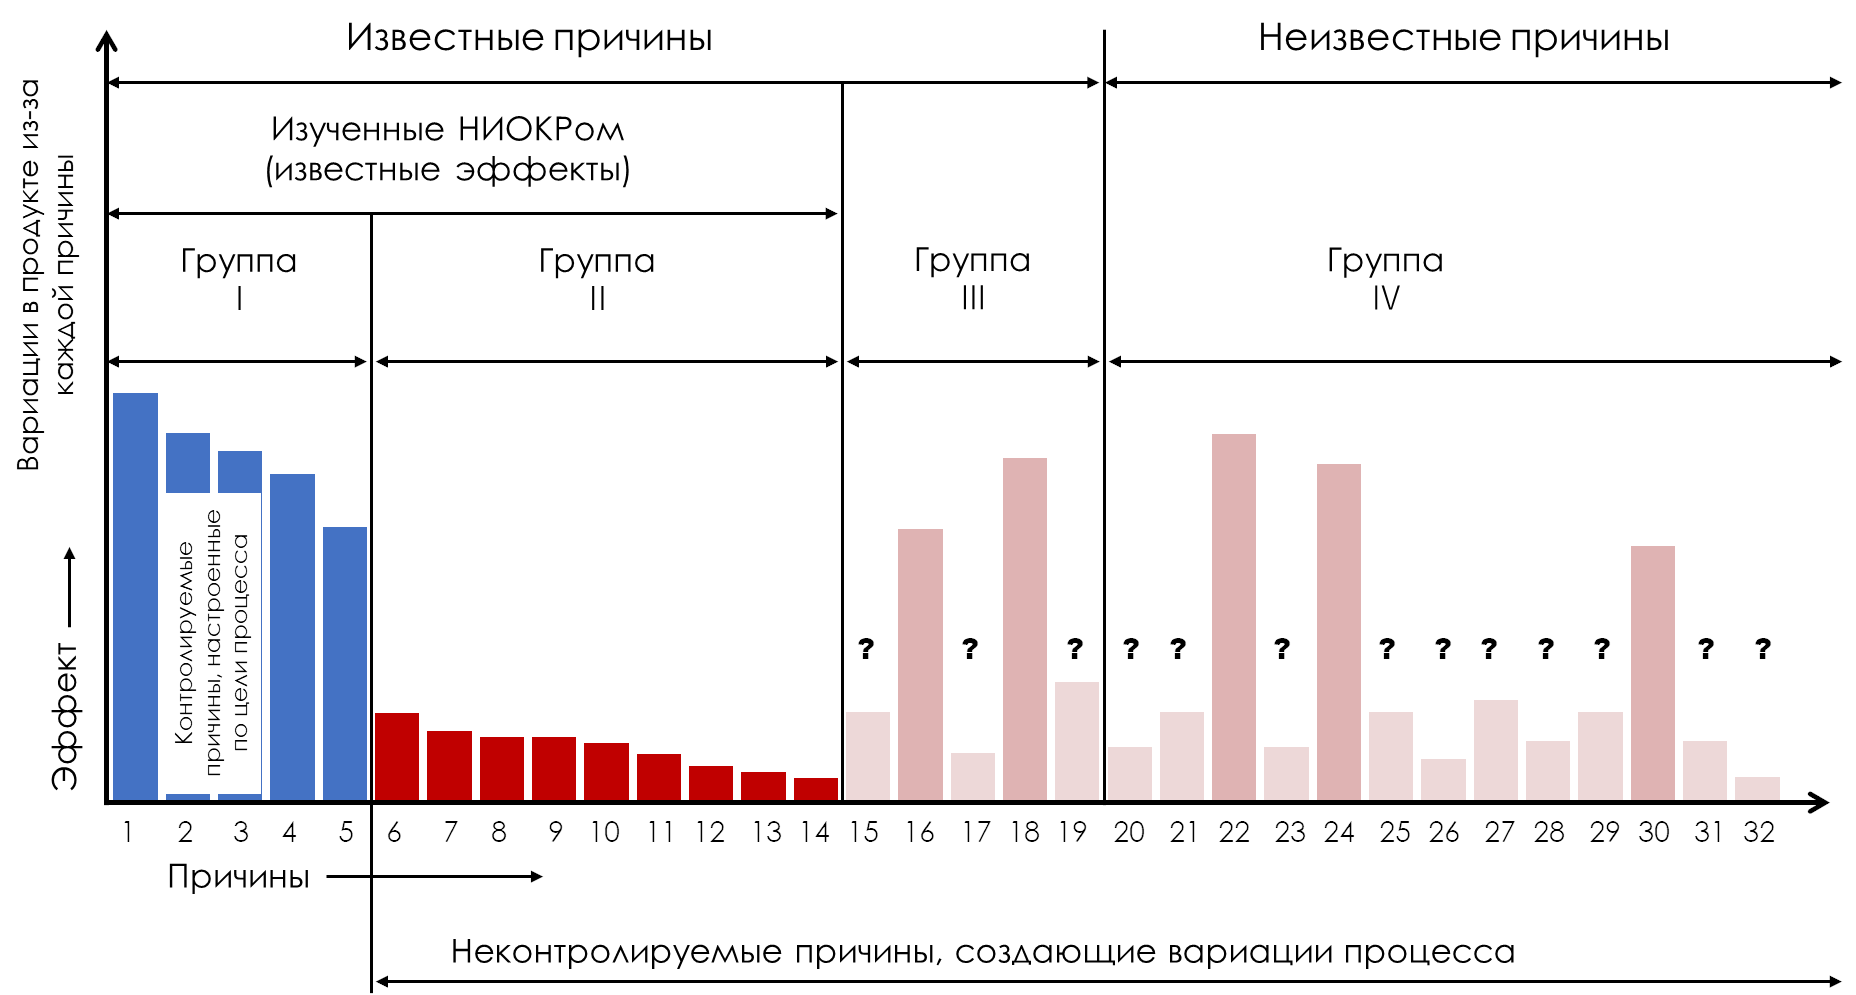
Figure 6: What we need to know
The idea behind the observational approach is that we don't really need to know the sizes of all the effects in Fig. 6. Rather, we only need to know which uncontrollable causes have the dominant effects (here causes 16, 18, 22, 24, and 30). Once we know which causes have effects large enough to change the flow of products, we know which causes need to be moved to the first group (Group I). And we can make this decision about these causes without actually quantifying the size of their consequences. The characteristics of the two main types of observational studies will be explained below.
Approaches to Data Tracking
Thanks to today's computing power, ingenious new approaches to analyzing existing data are becoming popular. These approaches used to be called data tracking, but today they are known as big data, artificial intelligence, or machine learning approaches. Regardless of the name, these approaches collect all available data into a database and use some mathematical techniques to find patterns, groupings, or relationships in the data. As promising as this sounds, and no matter how many variables are used, the main problem with these approaches is that the data will always have incomplete context.
Context is so important to analysis that it is the first axiom of data analysis: no data has any meaning outside of context. However, data tracking approaches will never have full context. No matter how many variables you include in the database, you will never be able to include variables from the fourth group (Group IV). Unknown cause-and-effect relationships will never be measured and therefore cannot be part of the database. (If we knew enough to measure their effects, they would be known causes rather than unknown causes.) Therefore, while data-tracing approaches can help you discover relationships between known causes and your product's characteristics, they cannot identify any - or unknown reasons.
The implicit assumption behind all data tracking methods is that there is homogeneity of conditions behind the data—that variables not included in the database have no real effect on the results being studied. However, there is no effective test of this fundamental assumption. When unknown causes dominate a process, they can completely distort the patterns detected by data tracking methods. Thus, although these approaches attempt to find patterns among known variables, they can be undermined by variables in the fourth group (Group IV).
Process behavior checklists
Process behavior control charts (Shewhart control charts) have proven to be an observational approach to process improvement. They give operational definition how to get the most out of any process. Current product performance records (points on the control chart) reflect the actual performance of the process. The control chart limits define the process potential—what the process is capable of achieving when it operates as intended with minimal variance. By mapping process performance to process potential, a process behavior control chart allows you to assess how close a process is to operating at full potential. It also allows us to determine when a change in process has occurred. And these changes are the key to identifying unknown causes with dominant effects from the fourth group (Group IV).
Some critics who do not understand how Shewhart's control charts work claim that they are "outdated." But when it comes to mathematics, age does not devalue the technique or change its applicability. The Pythagorean theorem is at least 2500 years old. Walter Shewhart created the process behavior control chart more than 90 years ago. The concept behind the control chart is 2,200 years older. It was Aristotle who taught us that we must look at those points where a system changes in order to discover the causes that affect the system. And this is essentially what process behavior control charts allow us to do.
By identifying the points at which a process changes, a process behavior control chart allows us to detect causes with dominant effects originating from any of the four groups (Groups I, II, III, IV).
By waiting for the process to demonstrate a change in behavior, we also allow the process to prioritize causes according to the size of their effects. In this way we discover those causes which have dominant effects, without wasting time and effort in studying many causes with insignificant effects.
Only with the approach of Shewhart and Aristotle can we discover the unknown causes from the fourth group (Group IV) that have dominant effects. Although a process behavior control chart can identify both known and unknown causes with dominant effects that create the signals detected by process behavior control charts, the ability to learn about the causes in the fourth group (Group IV) is the main benefit of using control charts. This allows us to learn about mistakes, bad practices and stupid things that actually happen in manufacturing but would never be studied in any research and development (R&D) program. And this allows us to detect in real time when something is going wrong so that it can be corrected in a timely manner. Thus, process behavior control charts are more general and reliable than other approaches.
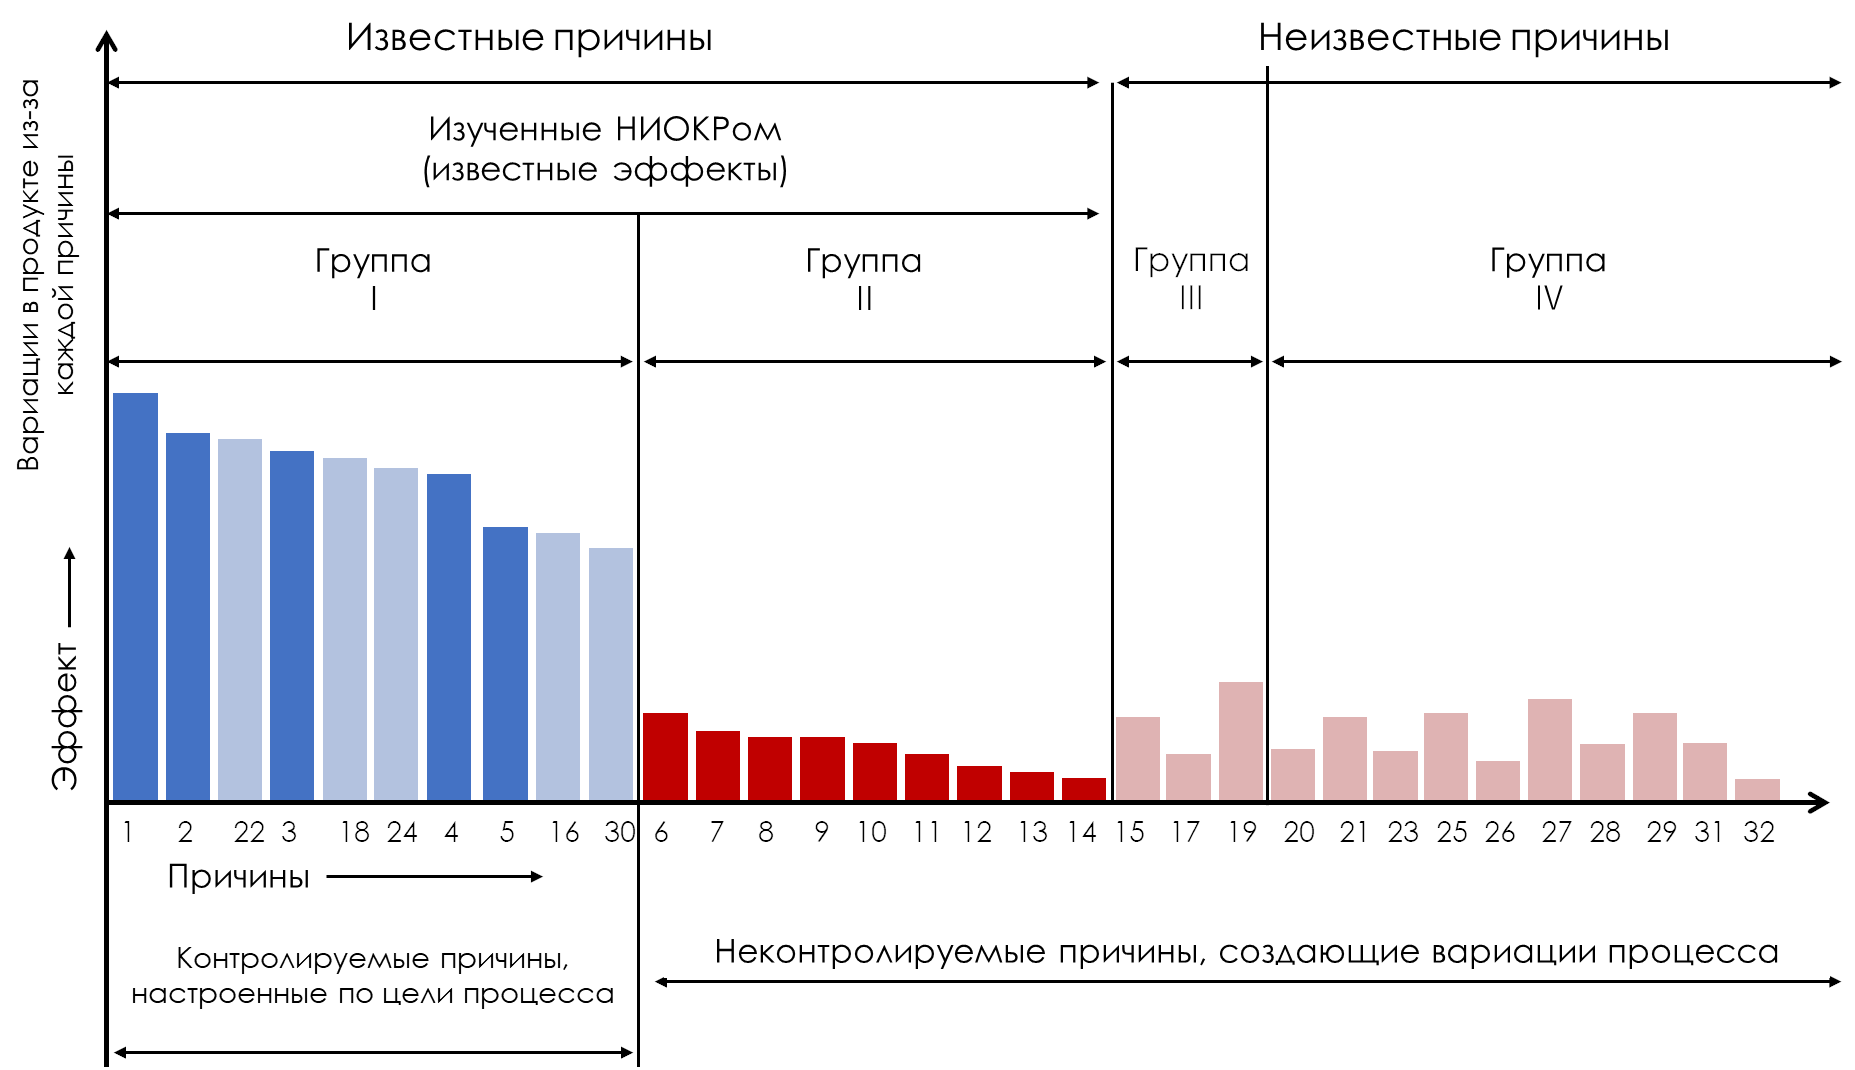
Figure 7. What can be achieved with a process behavior control chart
For the process shown in Fig. 7, the average cost of production and use (ACP&U) will be only 25 percent of the average cost of production and use for the process shown in Fig. 4. The fourfold increase in quality and productivity is due to the movement of reasons: 22, 18, 24, 16 and 30 into the first group.
See explanation of this paragraph in the description Taguchi quality loss functions .
Summary
Experimental approaches to process improvement can only study known cause-and-effect relationships. Although such studies are necessary in process tuning, they have limitations as a process improvement method. Cause studies in the first and second groups (Groups I, II) will replicate previous studies, and cause studies in the third group (Groups III) will be aimed at finding nuggets that were missed in previous studies. Thus, experimental studies of the causes in the second and third groups (Groups II, III) will require time, money, and effort to essentially confirm that most of these causes still have negligible effects. Moreover, experiments cannot study the causes of the fourth group (Group IV), and the experimental results may be undermined by the causes of the fourth group having a dominant effect.
Approaches to tracking data for process improvement include big data, artificial intelligence, and machine learning techniques that seek to model data and discover relationships using causes in the second and third groups (Groups II, III). Unfortunately, despite their complexity and sophistication, these approaches can also be undermined by the fourth group of causes (Group IV) with dominant effects.
Only a process behavior control chart explicitly looks for failures caused by both known and unknown causes. Aristotle's approach to studying the points at which a process changes allows us to discover things that are beyond the scope of experimental studies and that cannot be detected by data tracking methods. Additionally, the process behavior control chart approach does not waste time and effort on quantifying trivial effects. By always focusing on causes with dominant effects, process behavior control charts enable us to learn to run our processes predictably, with minimal variation and precisely on target.
So if you are confident that you can discover something that researchers and developers have missed, then go ahead and take an experimental approach to process improvement.
Or, if, unlike Aristotle, you are confident that your process does not change over time, use one of the data tracking approaches to improve the process. The complexity and sophistication of these techniques will not leave anyone indifferent. But keep in mind that your results may be as reliable as a house of cards.
If you simply want to improve your process, use Process Behavior Checklists to learn how to use your process to its full potential. Nothing even comes close to giving so much with so little effort.