Machine learning (ML). Training mathematical models with an algorithm Multiple Linear Regression
![[Multivariate Linear Regression] button](https://advanced-quality-tools.ru/images/buttons/LinearRegression.png)
Linear regression is a regression model used in statistics of the dependence of one (explained, dependent) variable on another or several other variables (factors, regressors, independent variables) with a linear dependence function.
Linear regression is defined as the process of determining the straight line that best fits a set of disparate data points. This line can then be projected to predict new data points. Due to its simplicity and important features, linear regression is a fundamental method in machine learning.
In the case of constructing a regression dependence of some random variable on a set of several random variables (one dependent variable with several independent variables), we speak of constructing multiple linear regression (Multiple Linear Regression). If the independent variable is only one, they talk about building a simple linear regression.
You can download an example of a structured spreadsheet file for creating a mathematical model and making predictions with the Multiple Linear Regression algorithm (a sample of this data is also used in the Decision Tree and Neural Network algorithms for regression models: XLSX .
Structured data from table files can be used for import: Excel workbook (*.xlsx); Excel binary workbook (*.xlsb); OpenDocument Spreadsheet (*.ods).
Where is it used?
Data analysis using multiple linear regression can be applied:
- as an effective (cost, time, resources) alternative" Planning experiments "to search for optimal modes of input parameters;
- for preliminary or alternative assessment of output parameters when measurement procedures for such parameters are carried out by expensive and/or time-consuming tests;
- for expert decision support systems (DSS), when decisions are associated with the risk of human errors.
Data Model Files
Our software can use trained Multivariate Linear Regression mathematical models for the scikit-learn library, created on other computers and saved in files (*.sav).
Multiple Linear Regression for Continuous Input and Output Measurements

Figure 1. Window for accessing machine learning (ML) functions. A list of drop-down menus is displayed when you hover the mouse over the main menu item [Data analysis methods].

Figure 2. Machine learning (ML) functions window. A tooltip appears when you hover your mouse over the button to navigate to multiple linear regression functions.

Figure 3. Multiple linear regression function window.

Figure 4. Multiple linear regression function window. In the drop-down list box [Types of graphs for model evaluation], the graph [Line graph. Current vs. Foretold].

Figure 5. Multiple linear regression function window. In the drop-down list box [Types of graphs for model evaluation], the graph [Line graph. Current vs. Foretold]. The graph is scaled along the X axis.

Figure 6. Multiple linear regression function window. In the drop-down list box [Types of graphs for model evaluation], the graph [Table of multiple linear regression coefficients] is selected.

Figure 7. Multiple linear regression function window. A drop-down tooltip appears when you hover your mouse over the button for selecting a table file to import new data.

Figure 8. Window for selecting a table file for training a mathematical model using multivariate linear regression.

Figure 9. Multiple linear regression function window. A drop-down tooltip appears when you hover the mouse over the [Save model] checkbox that is ticked. The model is saved in the appropriate application folder [SCCPython\resources\Model_AI] automatically when you select the required dependent variable in the drop-down list [Predict dependent variable values:]

Figure 10. Multiple linear regression function window. A message window about saving the mathematical model file is displayed.
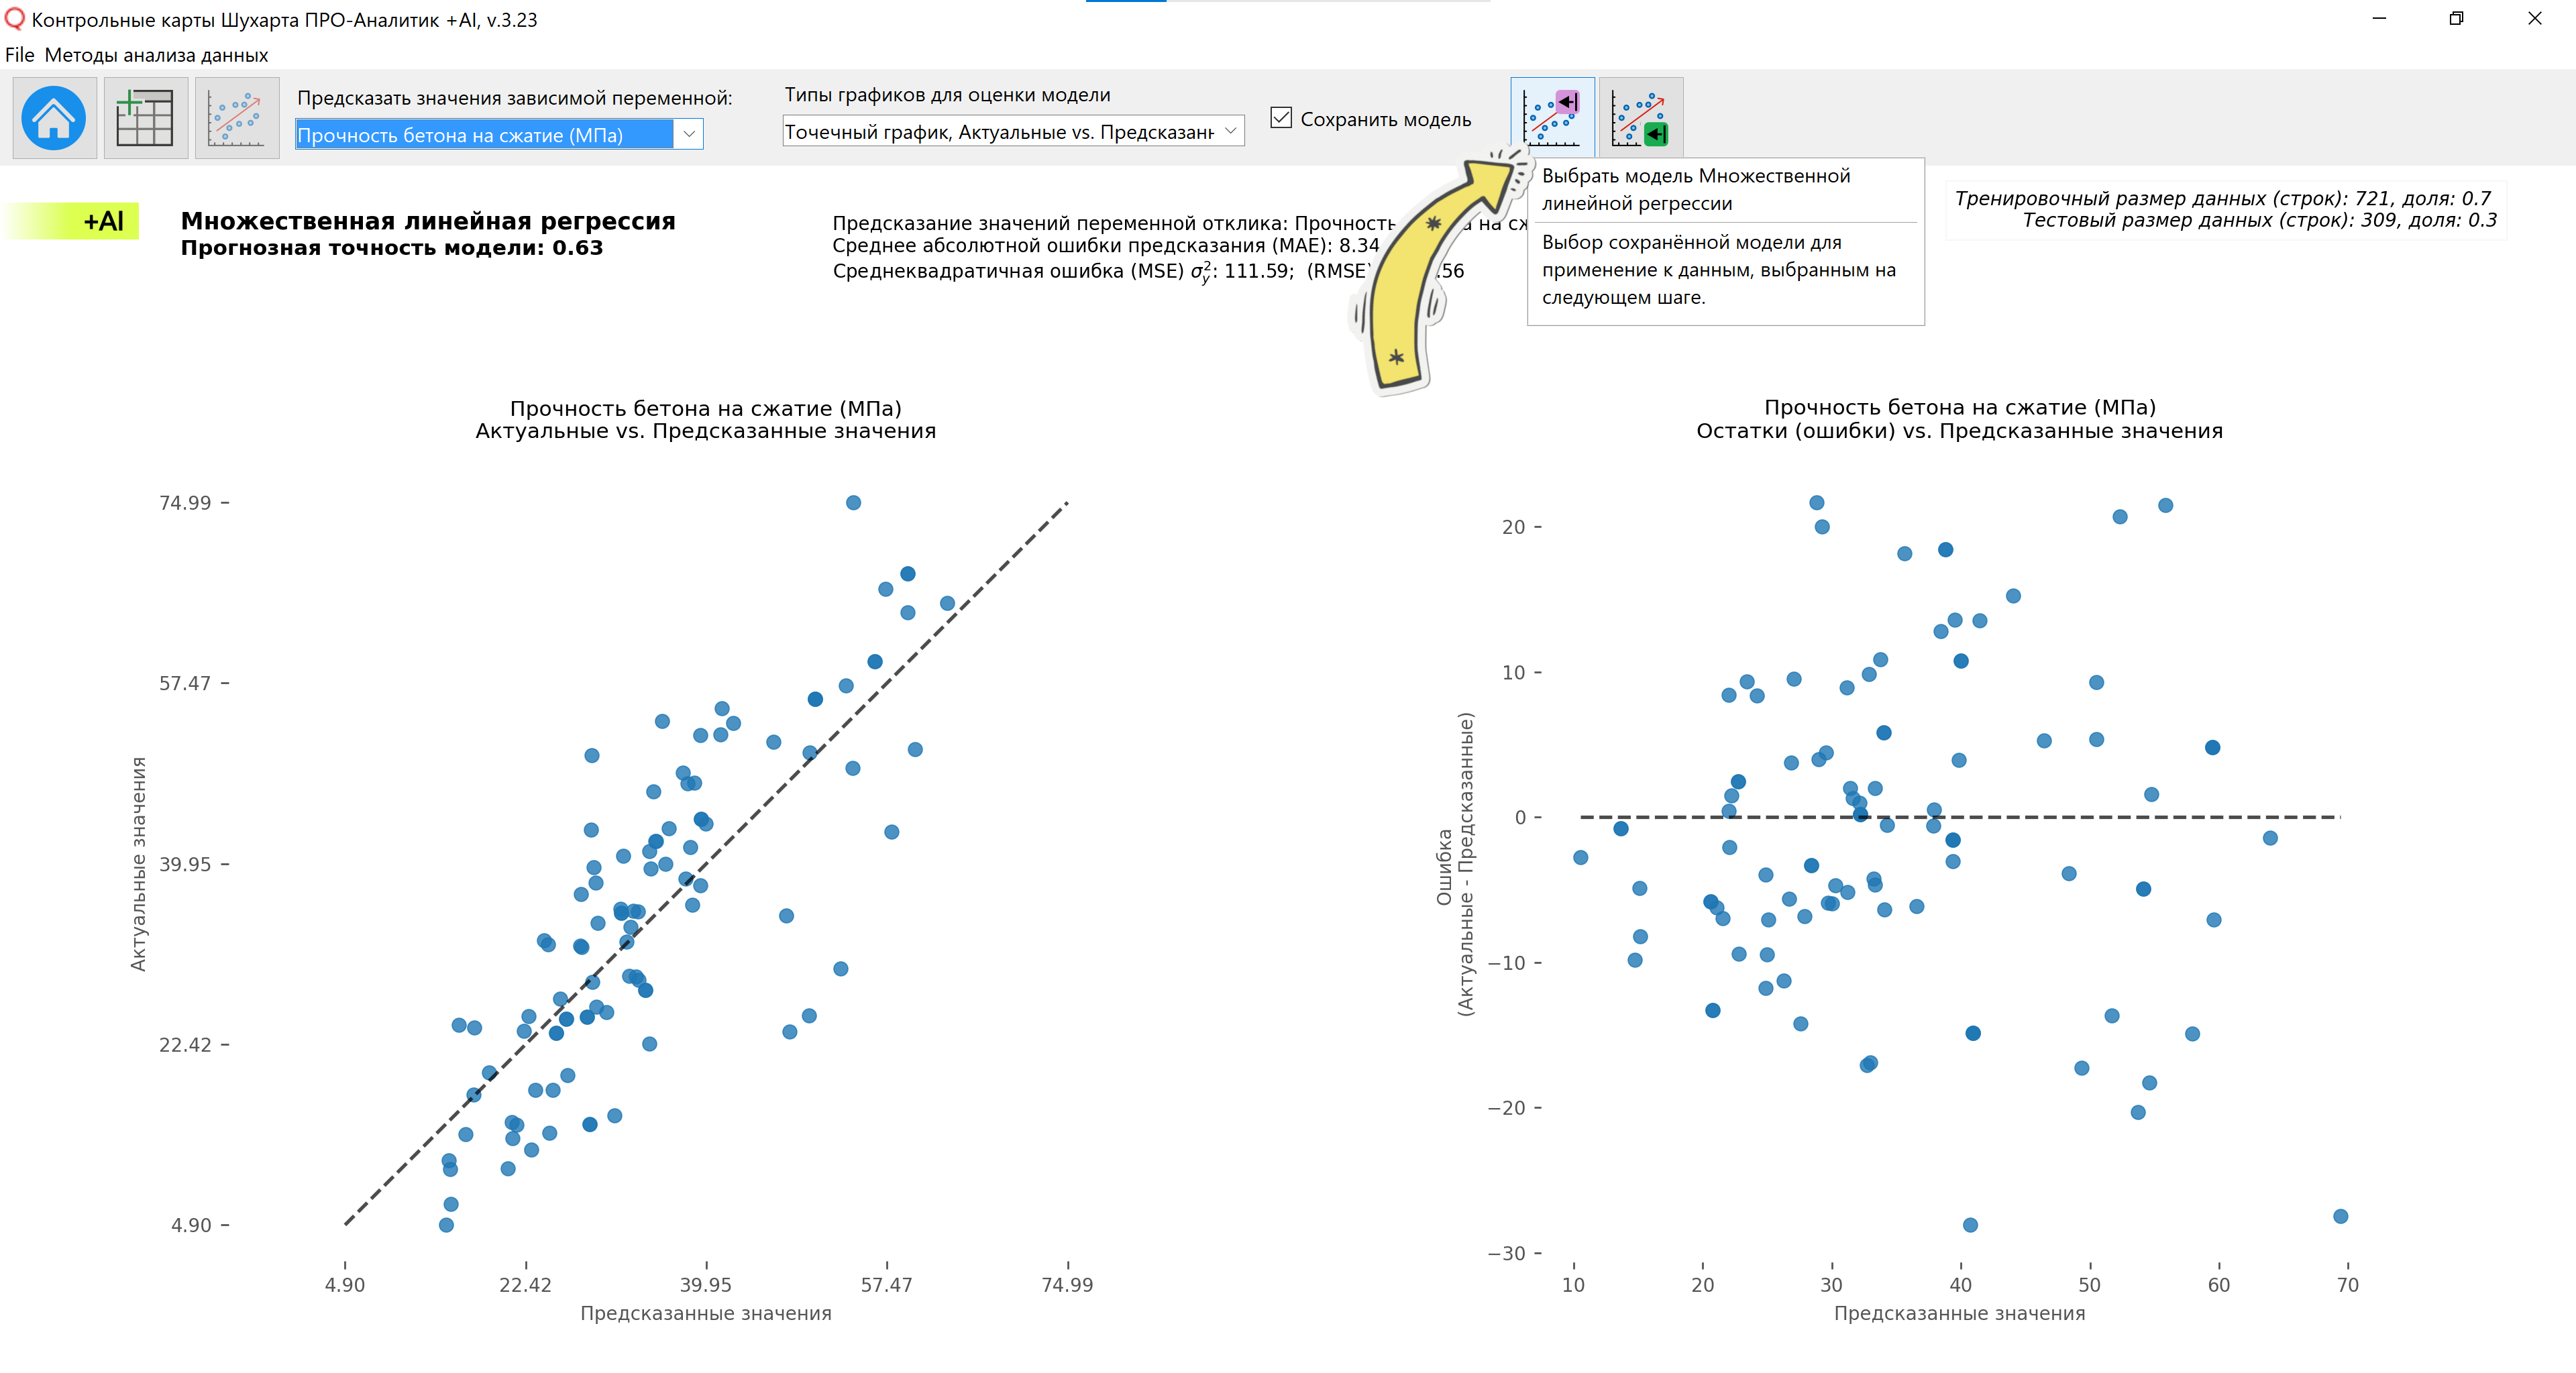
Figure 11. Multiple linear regression function window. A drop-down tooltip is displayed when you hover the mouse over the button to go to the control panel for selecting a saved mathematical model.

Figure 12. Multiple linear regression function window. Control panel for selecting a saved mathematical model. A drop-down tooltip is displayed when you hover the mouse over the path to the file of the selected mathematical model.

Figure 13. Multiple linear regression function window. Control panel for selecting a saved mathematical model. A drop-down tooltip appears when you hover your mouse over the button to go to the control panel for selecting a file with data for predicting the dependent variable.

Figure 14. Multiple linear regression function window. Dashboard for selecting data with independent variables and applying a mathematical model to predict the dependent variable. A drop-down tooltip appears when you hover the mouse over the path to the data file. A sheet in the data file is selected to predict the values of the indicator.

Figure 15. Multiple linear regression function window. Dashboard for selecting data with independent variables and applying a mathematical model to predict the dependent variable. A drop-down tooltip appears when you hover the mouse over the [Predict results] button.

Figure 16. Multiple linear regression function window. By clicking on the "Predict results" button, the model is applied to the data imported in the previous step and upon completion of the operation, a notification window opens to save the predicted values in an Excel file.
If your imported data contains one or more explanatory variable columns with categorical values, such as [male, female], an automatic One-Hot Encoding procedure will be performed to convert the data into new numeric coded columns [0, 1]. The hot encoded data will be saved in the original [xlsx] file in a new sheet.
Reasons why the accuracy of a mathematical model using the linear regression method can give low accuracy
- Inconsistency of Linear Regression Assumptions: Linear regression assumes a linear relationship between the features and the target variable. If nonlinear relationships exist, then linear regression may have poor accuracy.
- Wrong Feature Selection: Selecting the right features is very important for the accuracy of the linear regression model. If inappropriate or irrelevant features are included in the model, it may reduce its accuracy.
- Insufficient data: If the model is trained on a small amount of data, it may result in low accuracy. The more data available for training, the more accurate the linear regression model can be.
- Violation of the assumptions of independence of errors: Linear regression requires that the model errors be independent and identically distributed. If this assumption is violated, the accuracy of the model may be low.
- Multicollinearity of features: Multicollinearity occurs when the features in the model are highly correlated with each other. This may affect the accuracy of linear regression.
- Improper standardization of features: If features are not standardized, features with different scales may contribute unevenly to the model, which may lead to low accuracy.